Fig. A.2
Download original image
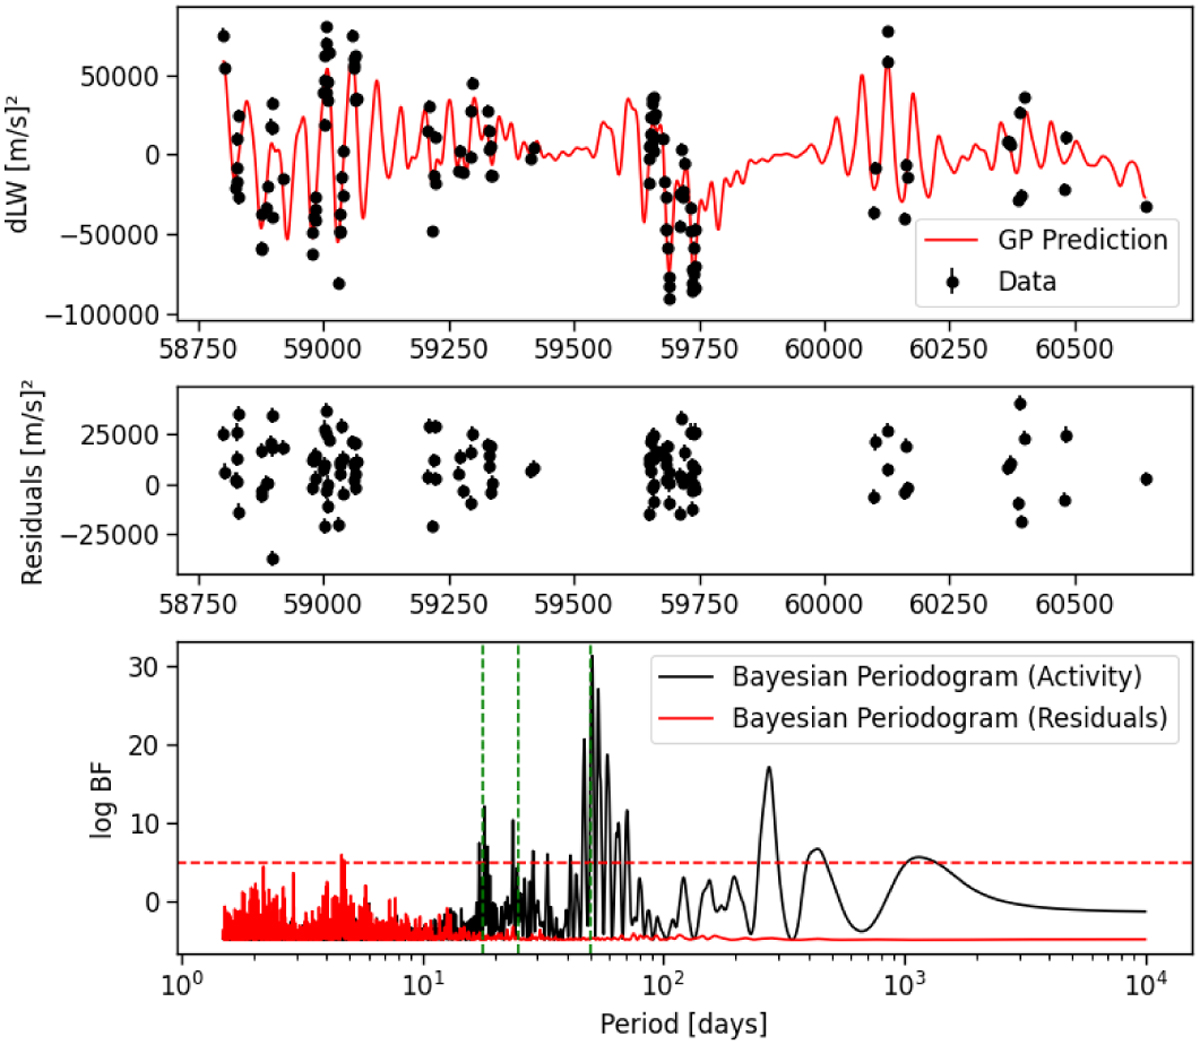
Top panel: dLW time series for GL 480, and the fitted GP model overlaid in red. Middle panel: Residuals after subtracting the GP model from the observations. Bottom panel: Bayesian periodograms for the activity signal (black curve) and residuals (red curve), plotted as a function of period (in days). The dashed green lines in the bottom panel mark periodicities at the stellar rotation period (Prot), at the one-half rotation period (Prot/2), and at the one-third rotation period (Prot/3). The significance level of log BF = 5 is indicated by the horizontal red dashed line.
Current usage metrics show cumulative count of Article Views (full-text article views including HTML views, PDF and ePub downloads, according to the available data) and Abstracts Views on Vision4Press platform.
Data correspond to usage on the plateform after 2015. The current usage metrics is available 48-96 hours after online publication and is updated daily on week days.
Initial download of the metrics may take a while.