Fig. 6.
Download original image
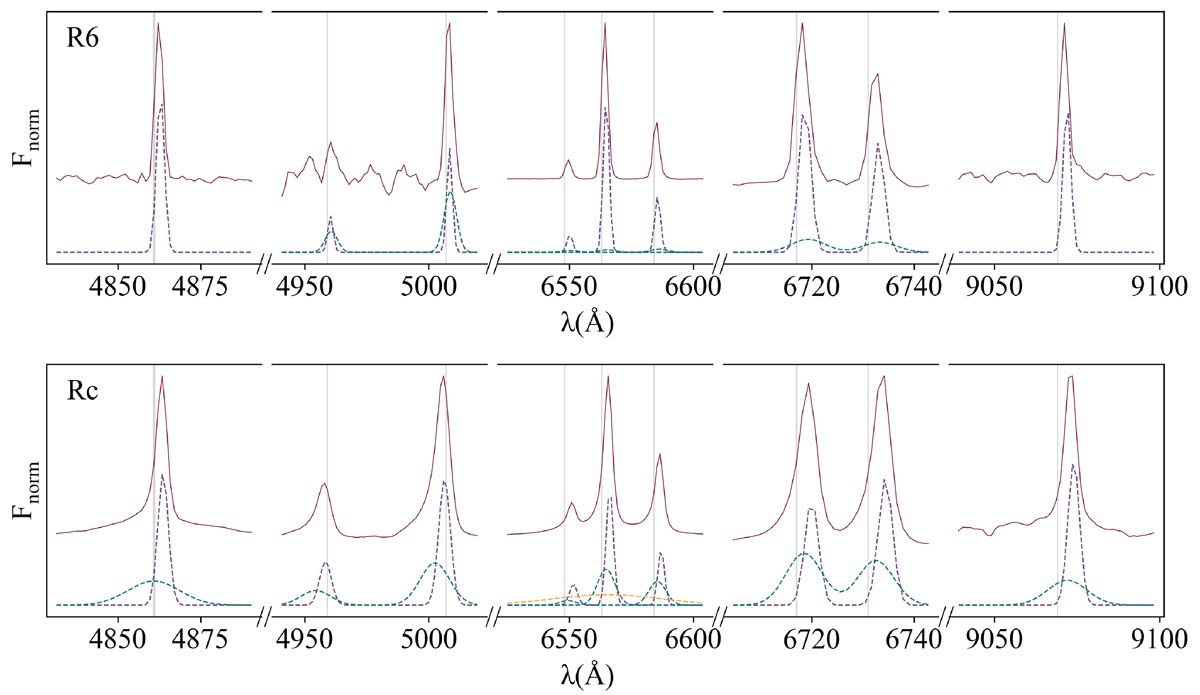
Spectra of regions R6 and Rc (top and bottom panels, respectively) showing the kinematical components fitted. From left to right: Hβ, [OIII]λλ 4959,5007 Å, Hα and [NII]λλ 6548,6584 Å, [SII]λλ 6717,6731 Å, and [SIII]λ 9069 Å emission lines are shown. The dotted purple lines show the components associated with the stellar clusters.
Current usage metrics show cumulative count of Article Views (full-text article views including HTML views, PDF and ePub downloads, according to the available data) and Abstracts Views on Vision4Press platform.
Data correspond to usage on the plateform after 2015. The current usage metrics is available 48-96 hours after online publication and is updated daily on week days.
Initial download of the metrics may take a while.