Fig. 4.
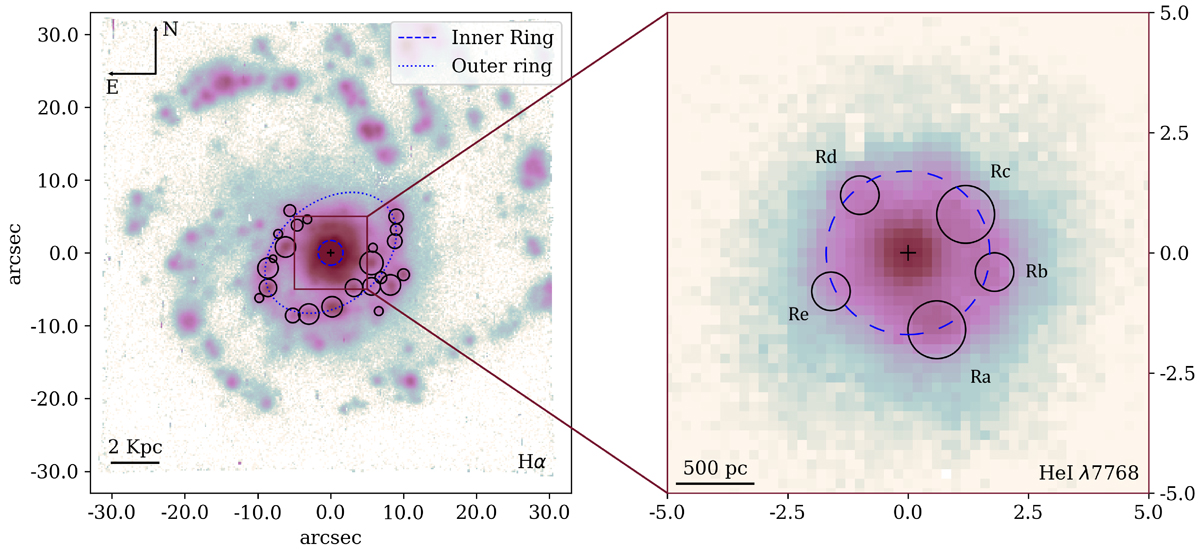
Download original image
HII region selection. Left panel: HII regions selected using our segregation programme on the Hα observed emission line map. Right panel: HII regions selected with our segregation programme with the HeI λ 7768 Å observed emission line map, in logarithmic colour scale. Orientation is north up, east to the left. The physical scale is represented in the bottom left corner of the map. The outer and inner rings are marked with blue ellipses.
Current usage metrics show cumulative count of Article Views (full-text article views including HTML views, PDF and ePub downloads, according to the available data) and Abstracts Views on Vision4Press platform.
Data correspond to usage on the plateform after 2015. The current usage metrics is available 48-96 hours after online publication and is updated daily on week days.
Initial download of the metrics may take a while.