Fig. 24.
Download original image
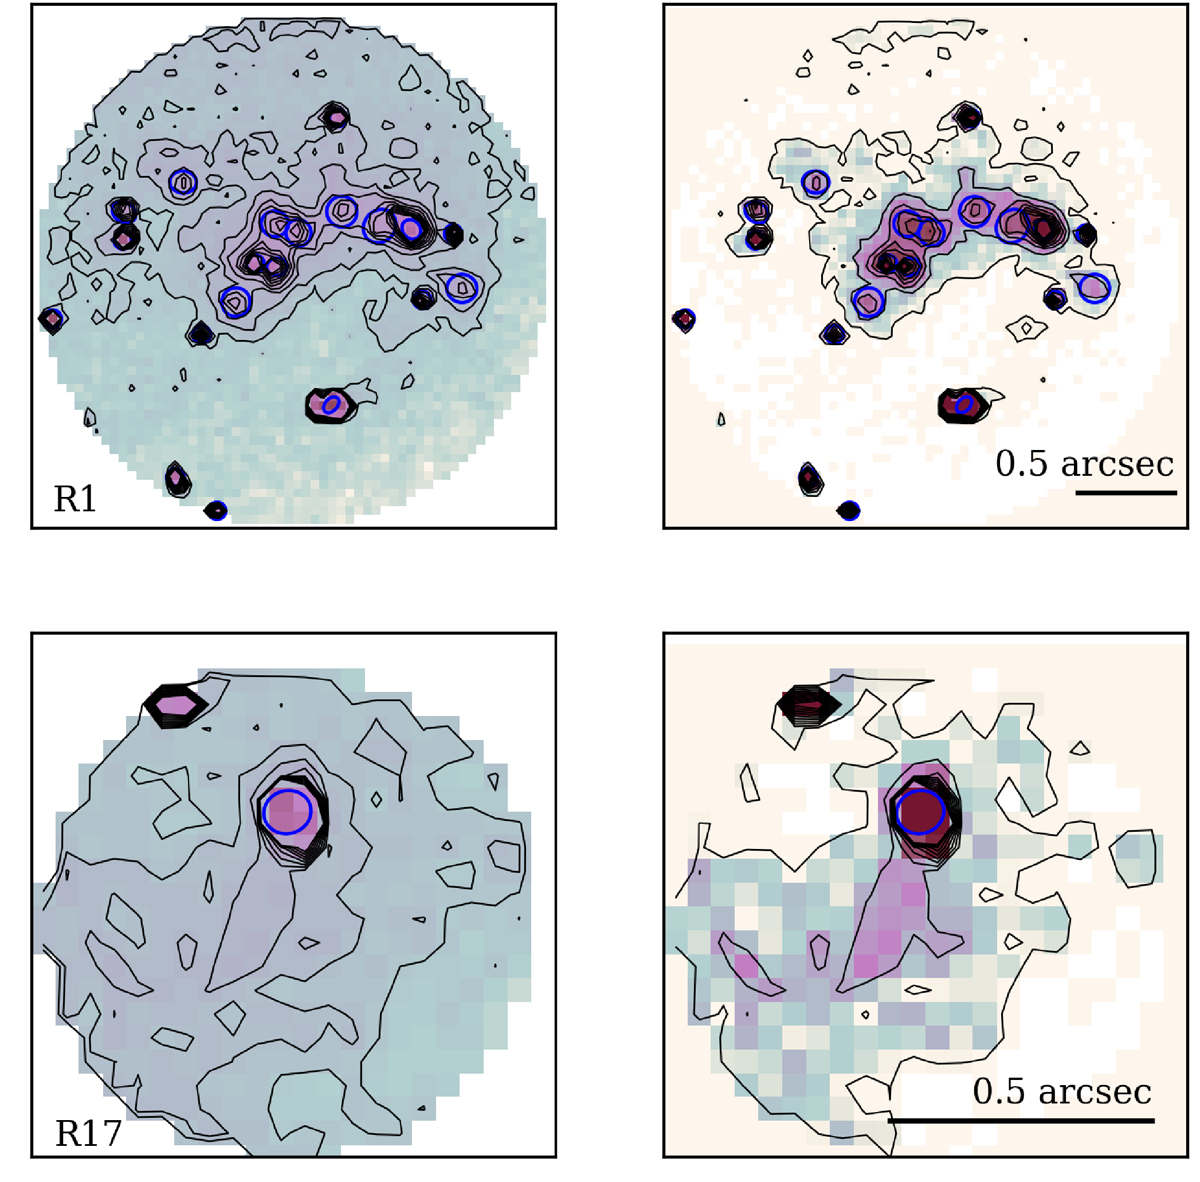
Results of the star cluster radius measurement procedure for regions R1 and R17 (upper and lower panels, respectively). The left panels show the F606W WFPC2-HST image for each selected region and the right panels show the same image after the background subtraction. Selected clusters are shown with blue circles, and the angular scale is shown in the corner of each panel.
Current usage metrics show cumulative count of Article Views (full-text article views including HTML views, PDF and ePub downloads, according to the available data) and Abstracts Views on Vision4Press platform.
Data correspond to usage on the plateform after 2015. The current usage metrics is available 48-96 hours after online publication and is updated daily on week days.
Initial download of the metrics may take a while.