Open Access
Fig. 20.
Download original image
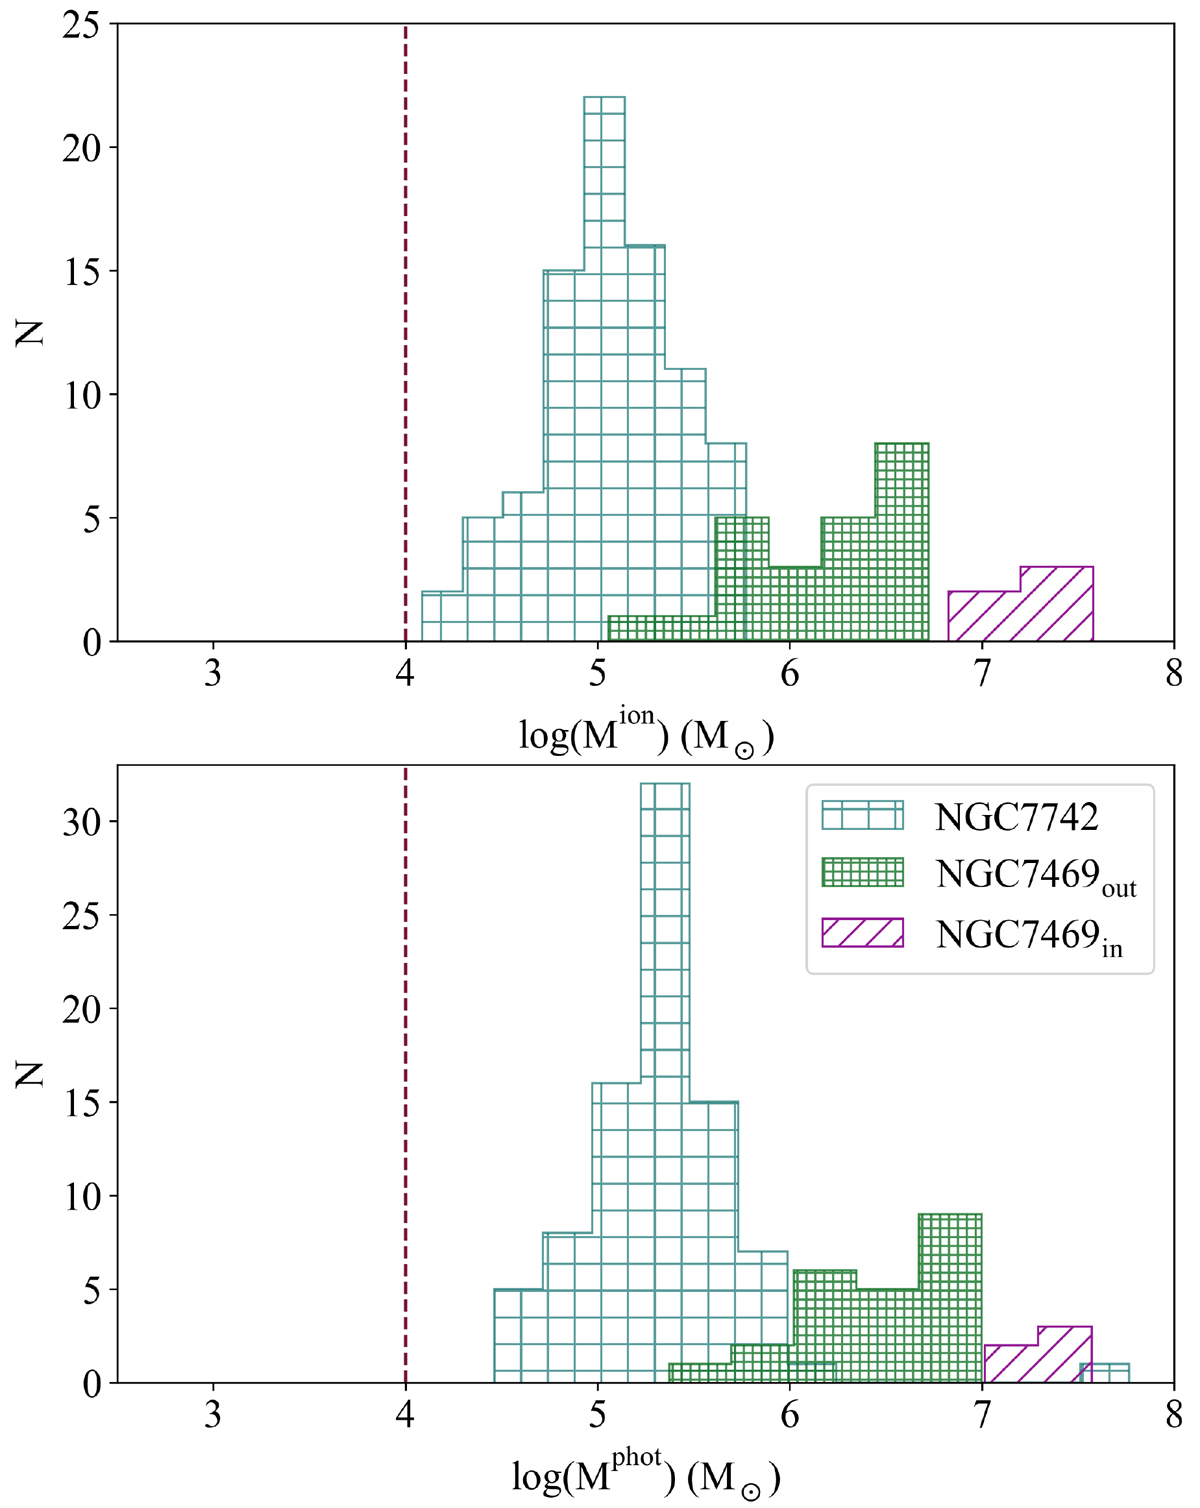
Histograms of the distributions of ionising (top panel) and photometric (bottom panel) stellar masses for the outer and inner ring HII regions, in green and purple, respectively. The dashed line corresponds to 104 M⊙ (see text for details).
Current usage metrics show cumulative count of Article Views (full-text article views including HTML views, PDF and ePub downloads, according to the available data) and Abstracts Views on Vision4Press platform.
Data correspond to usage on the plateform after 2015. The current usage metrics is available 48-96 hours after online publication and is updated daily on week days.
Initial download of the metrics may take a while.