Fig. 2.
Download original image
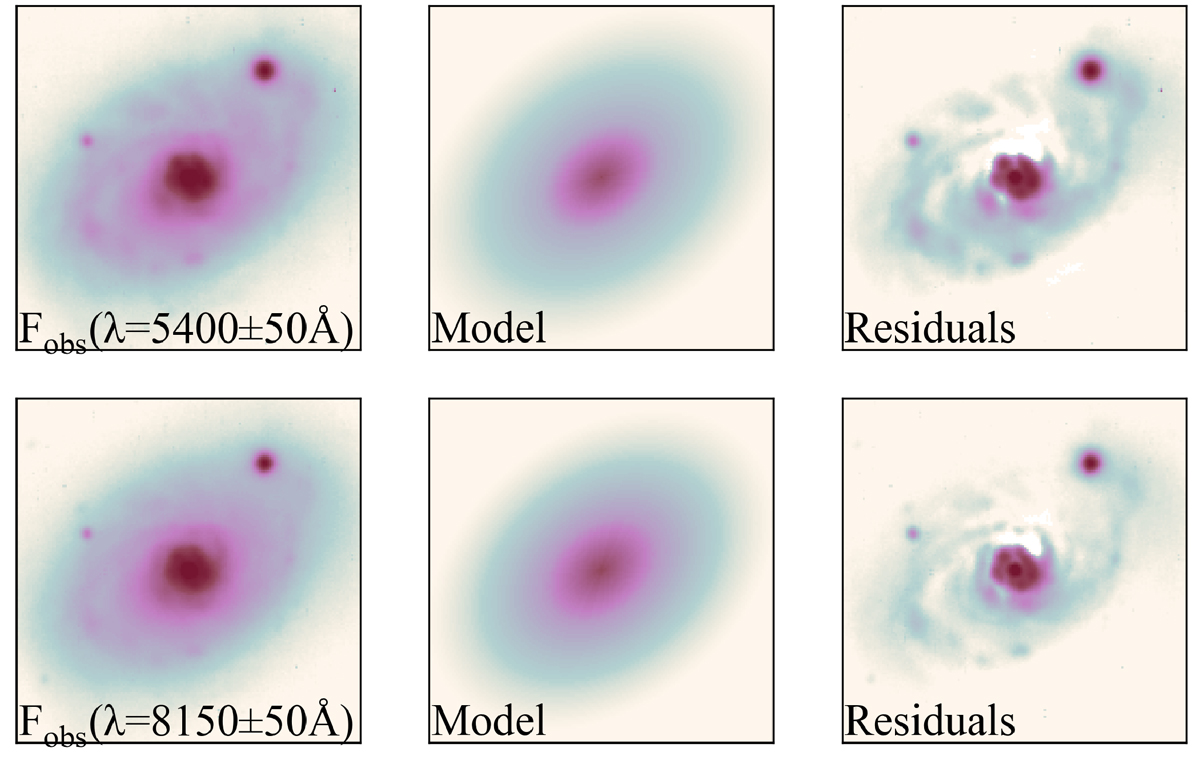
Maps of observed continua. Left panels: Maps of the observed continua in the blue and red parts of the spectrum (5400 Å and 8150 Å, respectively) in logarithmic scale). Centre panels: Fitted models to the galaxy disc profile (see text for details). Right panels: Residuals between the continuum maps and the disc fitted profile. Orientation is north up, east to the left. The panel sizes are 32 arcsec × 32 arcsec.
Current usage metrics show cumulative count of Article Views (full-text article views including HTML views, PDF and ePub downloads, according to the available data) and Abstracts Views on Vision4Press platform.
Data correspond to usage on the plateform after 2015. The current usage metrics is available 48-96 hours after online publication and is updated daily on week days.
Initial download of the metrics may take a while.