Fig. 12.
Download original image
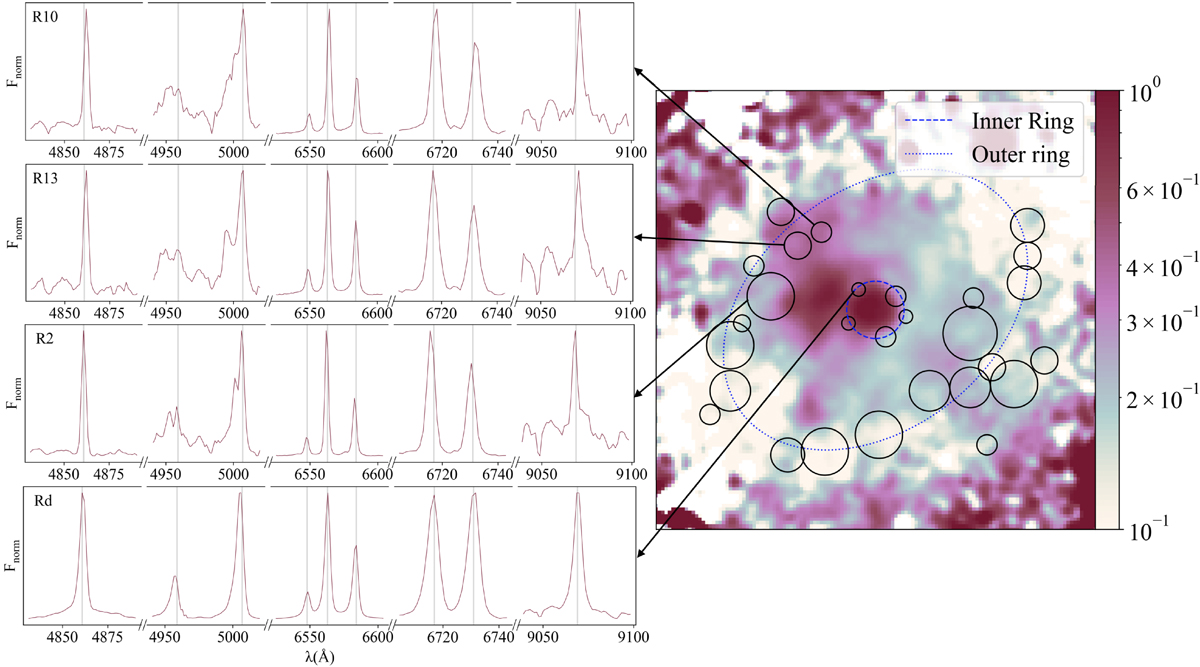
Emission line spectra of regions with multiple kinematical components. Left panels, from top to bottom: Spectra of regions R10, R13, R2, and Rd. Shown from left to right are the emission lines of Hβ, [OIII]λλ 4069,5007 Å, Hα and [NII]λλ 6548,6584 Å, [SII]λλ 6717,6731 Å and [SIII]λ 9069 Å are shown. Right panel: Map of the observed [OIII]λ 5007 Å / [NII]λ 6583 Å ratio smoothed with a Gaussian function of σ = 1.5 pix.
Current usage metrics show cumulative count of Article Views (full-text article views including HTML views, PDF and ePub downloads, according to the available data) and Abstracts Views on Vision4Press platform.
Data correspond to usage on the plateform after 2015. The current usage metrics is available 48-96 hours after online publication and is updated daily on week days.
Initial download of the metrics may take a while.