Open Access
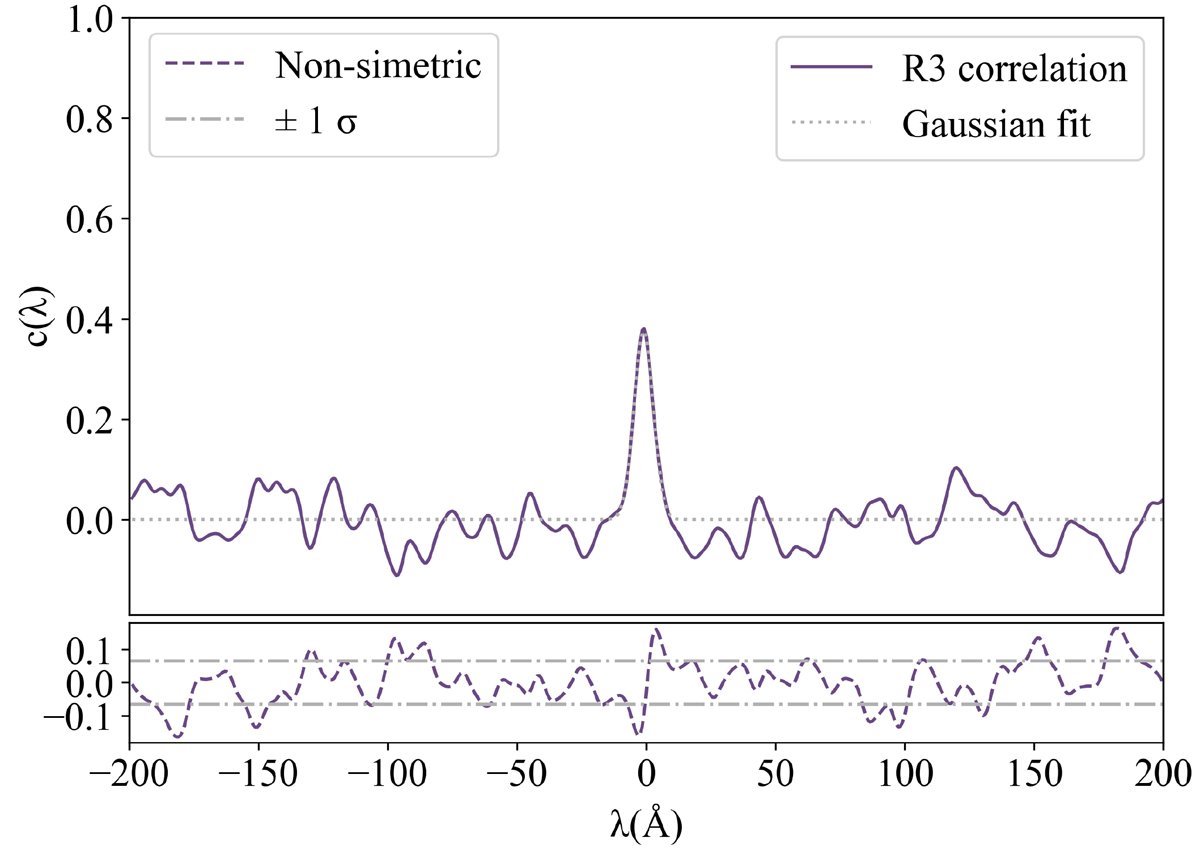
Fig. 11.
Download original image
Cross-correlation function example. The upper panel shows the cross-correlation function of region R3 with the stellar template used. The lower panel shows the asymmetric noise component of this function.
Current usage metrics show cumulative count of Article Views (full-text article views including HTML views, PDF and ePub downloads, according to the available data) and Abstracts Views on Vision4Press platform.
Data correspond to usage on the plateform after 2015. The current usage metrics is available 48-96 hours after online publication and is updated daily on week days.
Initial download of the metrics may take a while.