Fig. 4
Download original image
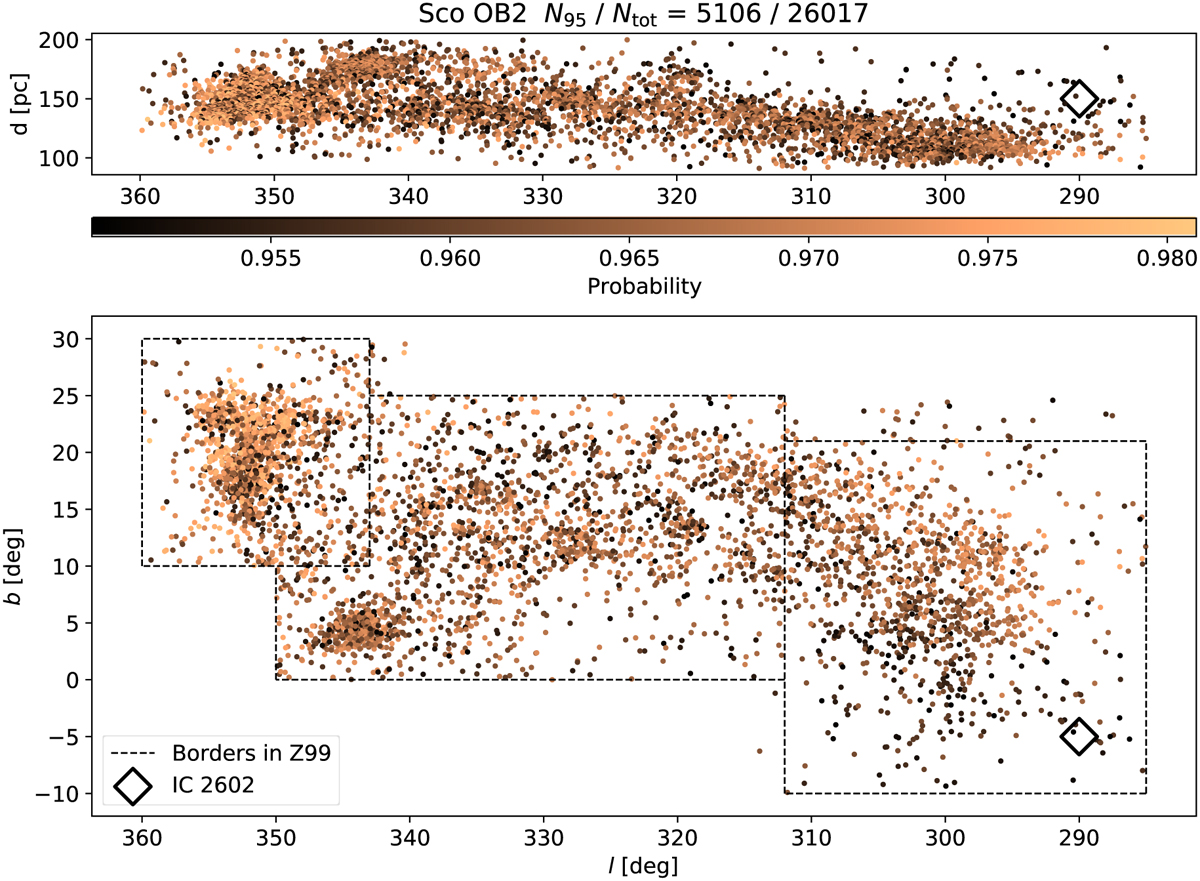
Sky map presenting the members of Sco OB2 based on our analysis. Upper panel: the distance (1000/ϖ) of the members against Galactic longitude l. Lower panel: members shown in the Galactic coordinate plane. The subgroup boundaries in de Zeeuw et al. (1999) are marked by the black dashed lines. In both panels, the membership probability is color coded as represented by the color bar. The open cluster IC 2602 is shown as a black diamond; according to our analysis, it is not part of Sco OB2.
Current usage metrics show cumulative count of Article Views (full-text article views including HTML views, PDF and ePub downloads, according to the available data) and Abstracts Views on Vision4Press platform.
Data correspond to usage on the plateform after 2015. The current usage metrics is available 48-96 hours after online publication and is updated daily on week days.
Initial download of the metrics may take a while.