Fig. 3
Download original image
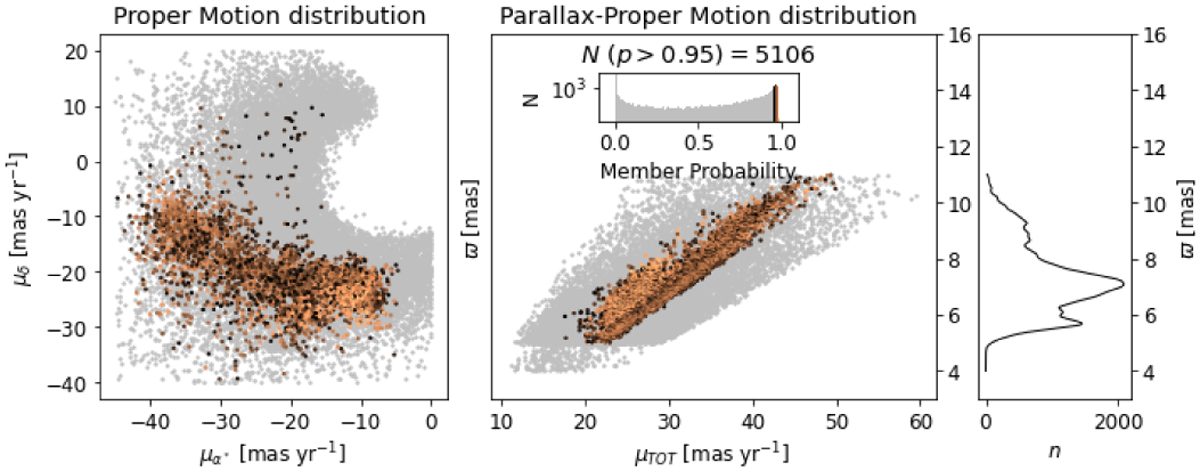
Result of membership selection. The members are represented by the points color coded according to membership probability from 0.95 to ~0.98 (black to orange). The brighter the color, the higher the probability. The nonmembers are colored gray. Left panel: members and nonmembers plotted in proper motion space (equatorial coordinates). Middle panel: members and nonmembers plotted in parallax – total proper motion space. The inset shows a histogram of membership probability. Right panel: smoothed parallax distribution of the members. The horizontal axis shows the number density, while the vertical axis displays the parallax.
Current usage metrics show cumulative count of Article Views (full-text article views including HTML views, PDF and ePub downloads, according to the available data) and Abstracts Views on Vision4Press platform.
Data correspond to usage on the plateform after 2015. The current usage metrics is available 48-96 hours after online publication and is updated daily on week days.
Initial download of the metrics may take a while.