Fig. 25
Download original image
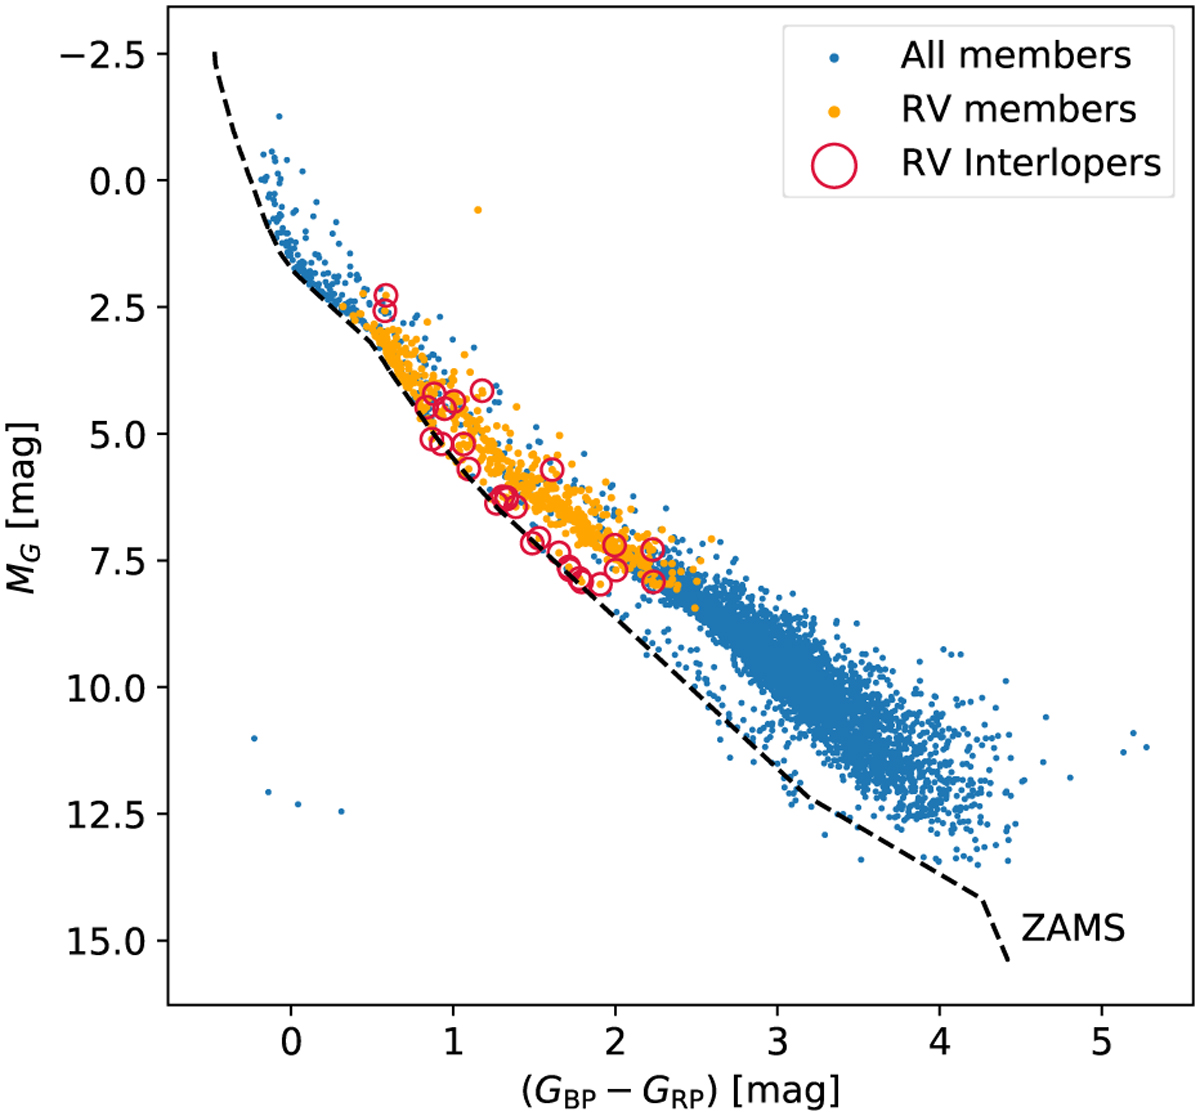
Potential interlopers due to deviating radial velocity plotted in the color-magnitude diagram. The blue points show all the members of Sco OB2 that pass the BP/RP excess filter; the orange points are the members with radial velocity in Gaia DR2; the red circles mark the potential interlopers discussed in Sect. 5.2. For reference, the ZAMS model is included as a black dashed line. The data points are not corrected for extinction and reddening.
Current usage metrics show cumulative count of Article Views (full-text article views including HTML views, PDF and ePub downloads, according to the available data) and Abstracts Views on Vision4Press platform.
Data correspond to usage on the plateform after 2015. The current usage metrics is available 48-96 hours after online publication and is updated daily on week days.
Initial download of the metrics may take a while.