Fig. 21
Download original image
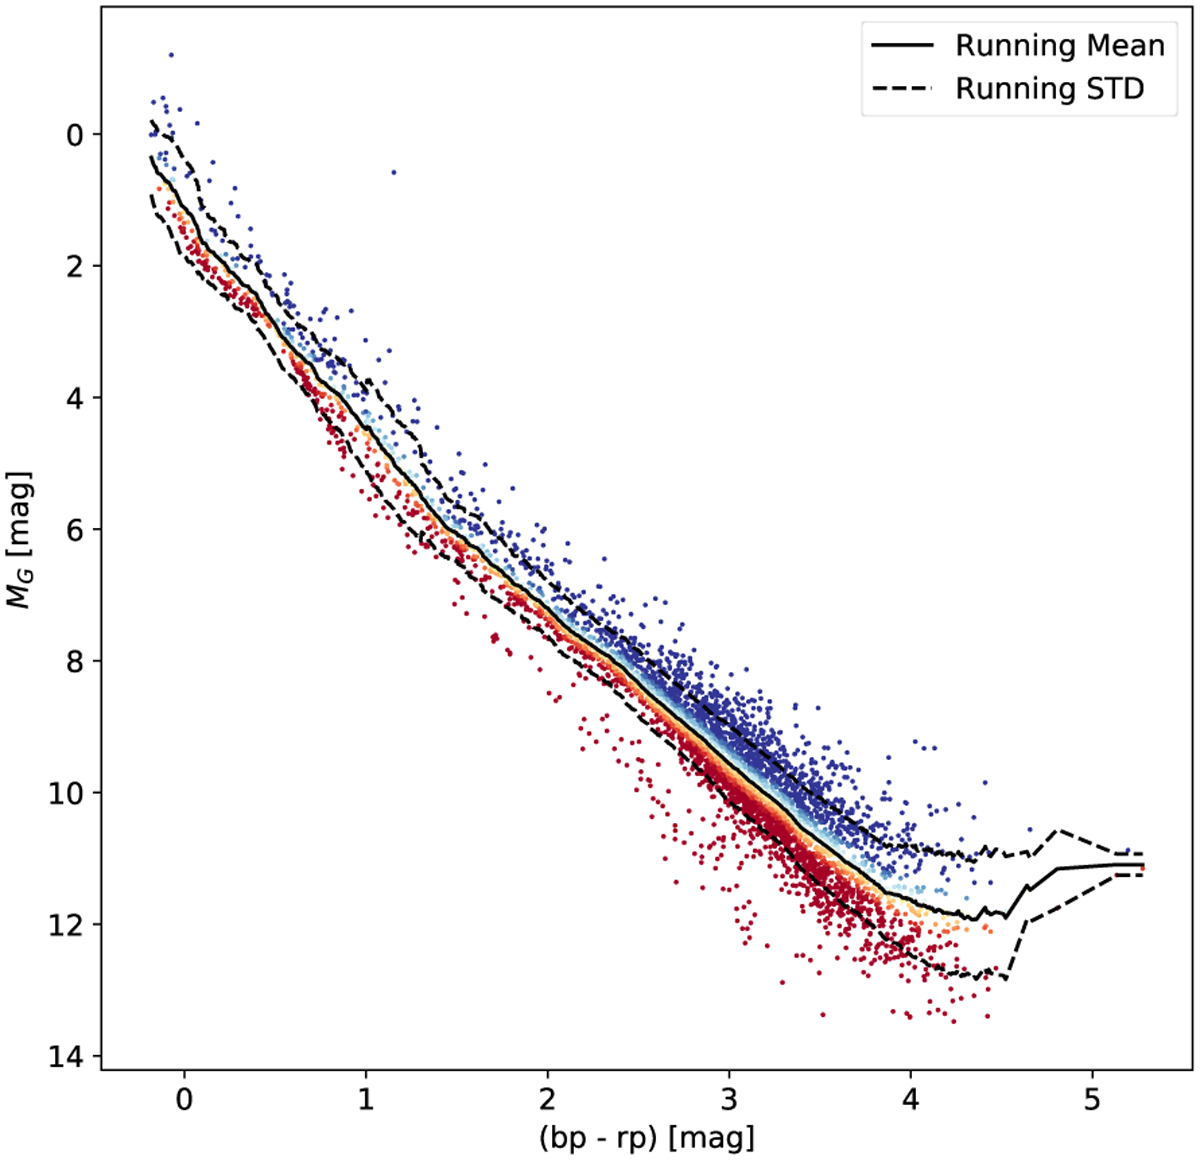
Color-magnitude diagram showing the empirical isochrone produced by a running mean (black line), and offset isochrones defined in units of the running standard deviation (dashed line). The members brighter than the running mean (negative offset) are colored blue, the ones fainter (positive offset) colored red, and those close to the mean (near zero offset) colored yellow.
Current usage metrics show cumulative count of Article Views (full-text article views including HTML views, PDF and ePub downloads, according to the available data) and Abstracts Views on Vision4Press platform.
Data correspond to usage on the plateform after 2015. The current usage metrics is available 48-96 hours after online publication and is updated daily on week days.
Initial download of the metrics may take a while.