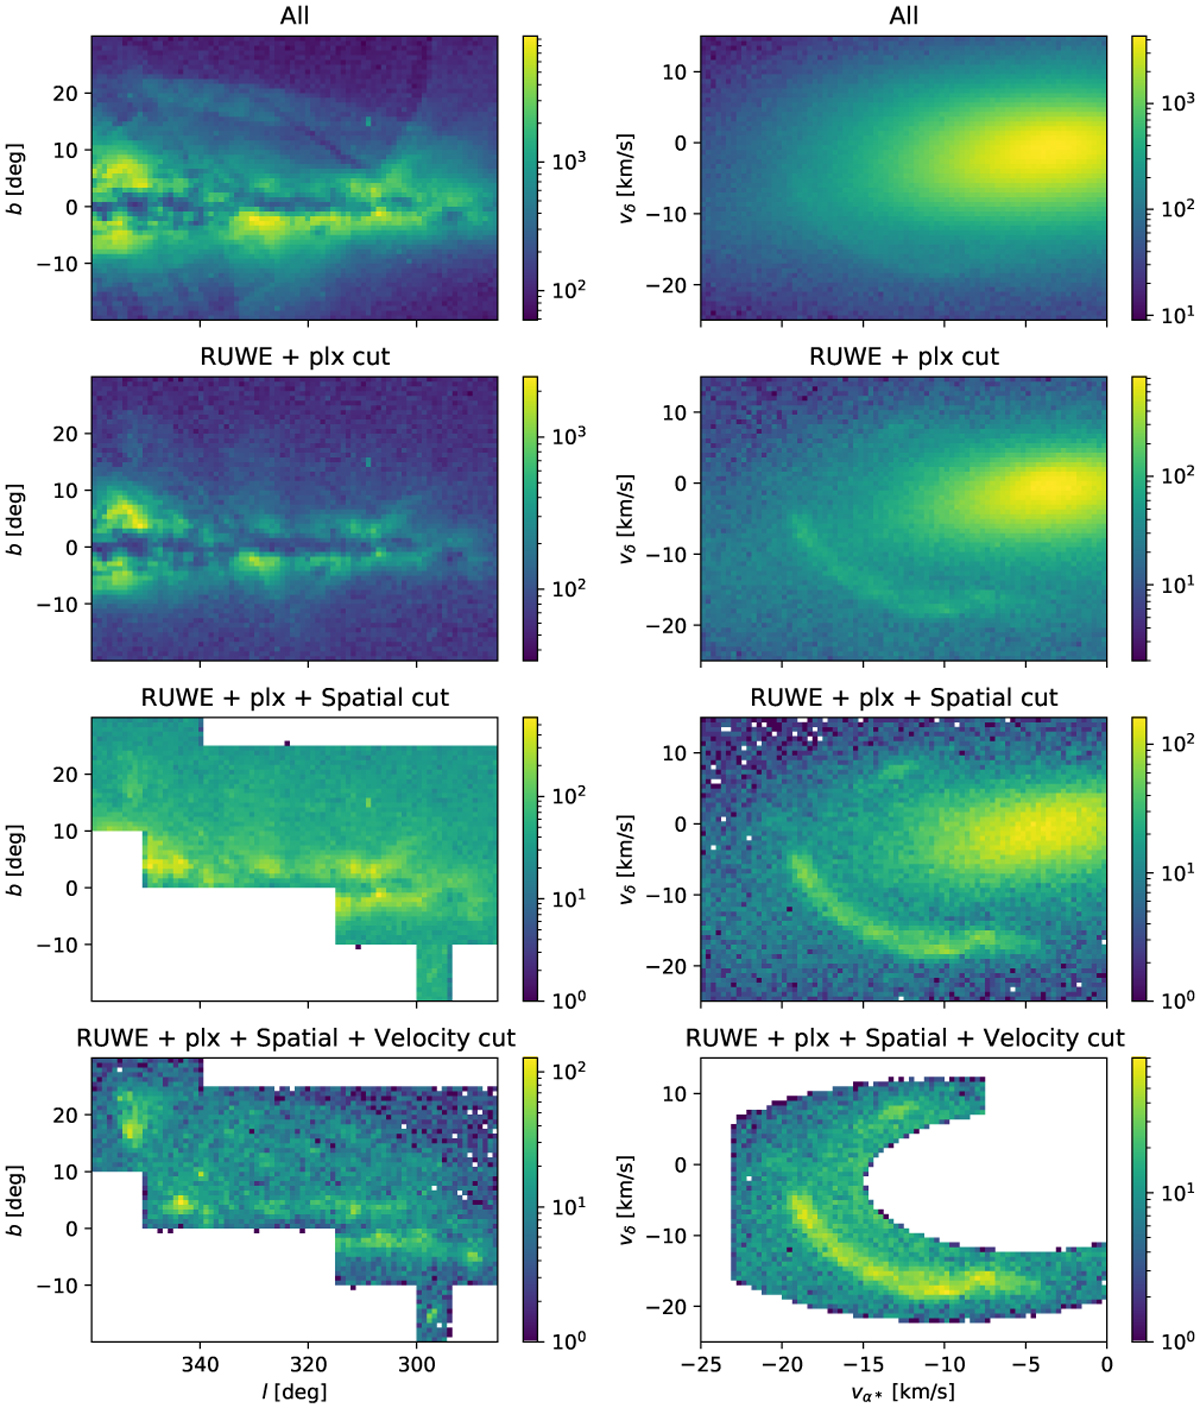
Fig. 2
Download original image
Different stages applied to preselect the data. Left column: stellar density maps in the l-b plane; Right column: stellar density maps in the transverse velocity plane. The color bars show the color coding of point-source density in log-scale. Row 1: all the candidates downloaded from the Gaia Archive. Row 2: after applying the filter of RUWE < 1.4 and (σϖ/ϖ) < 0.2. Row 3: in addition to the previous filters, apply all the conditions in the first table of Table 2. Row 4: in addition to the previous cuts, apply all the conditions in the second and third table in Table 2. This set contains the preselected candidates.
Current usage metrics show cumulative count of Article Views (full-text article views including HTML views, PDF and ePub downloads, according to the available data) and Abstracts Views on Vision4Press platform.
Data correspond to usage on the plateform after 2015. The current usage metrics is available 48-96 hours after online publication and is updated daily on week days.
Initial download of the metrics may take a while.