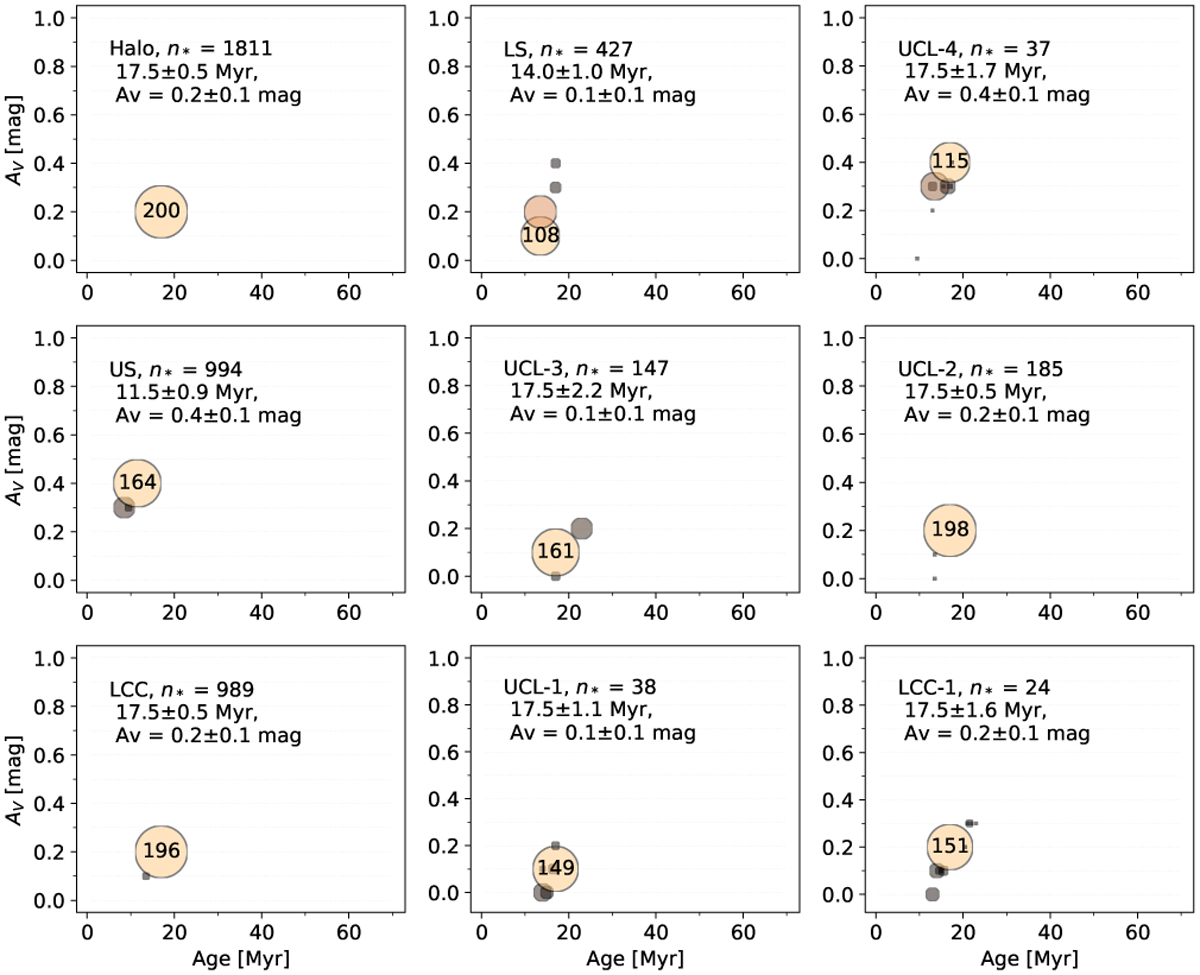
Fig. 19
Download original image
Results of the bootstrap method to estimate the errors on age and extinction, per subgroup. Each circle centers on an age-extinction combination that occurs at least once in the 200 redrawn samples. The size of the circle is proportional to the number of occurrences. The biggest circle represents the most frequent age-extinction combination, and is marked with the highest occurrence number. The higher the number, the more yellow the circle. The inset lists the name of the subgroup, the number of stars, the median age and extinction, and the uncertainty.
Current usage metrics show cumulative count of Article Views (full-text article views including HTML views, PDF and ePub downloads, according to the available data) and Abstracts Views on Vision4Press platform.
Data correspond to usage on the plateform after 2015. The current usage metrics is available 48-96 hours after online publication and is updated daily on week days.
Initial download of the metrics may take a while.