Open Access
Fig. 18
Download original image
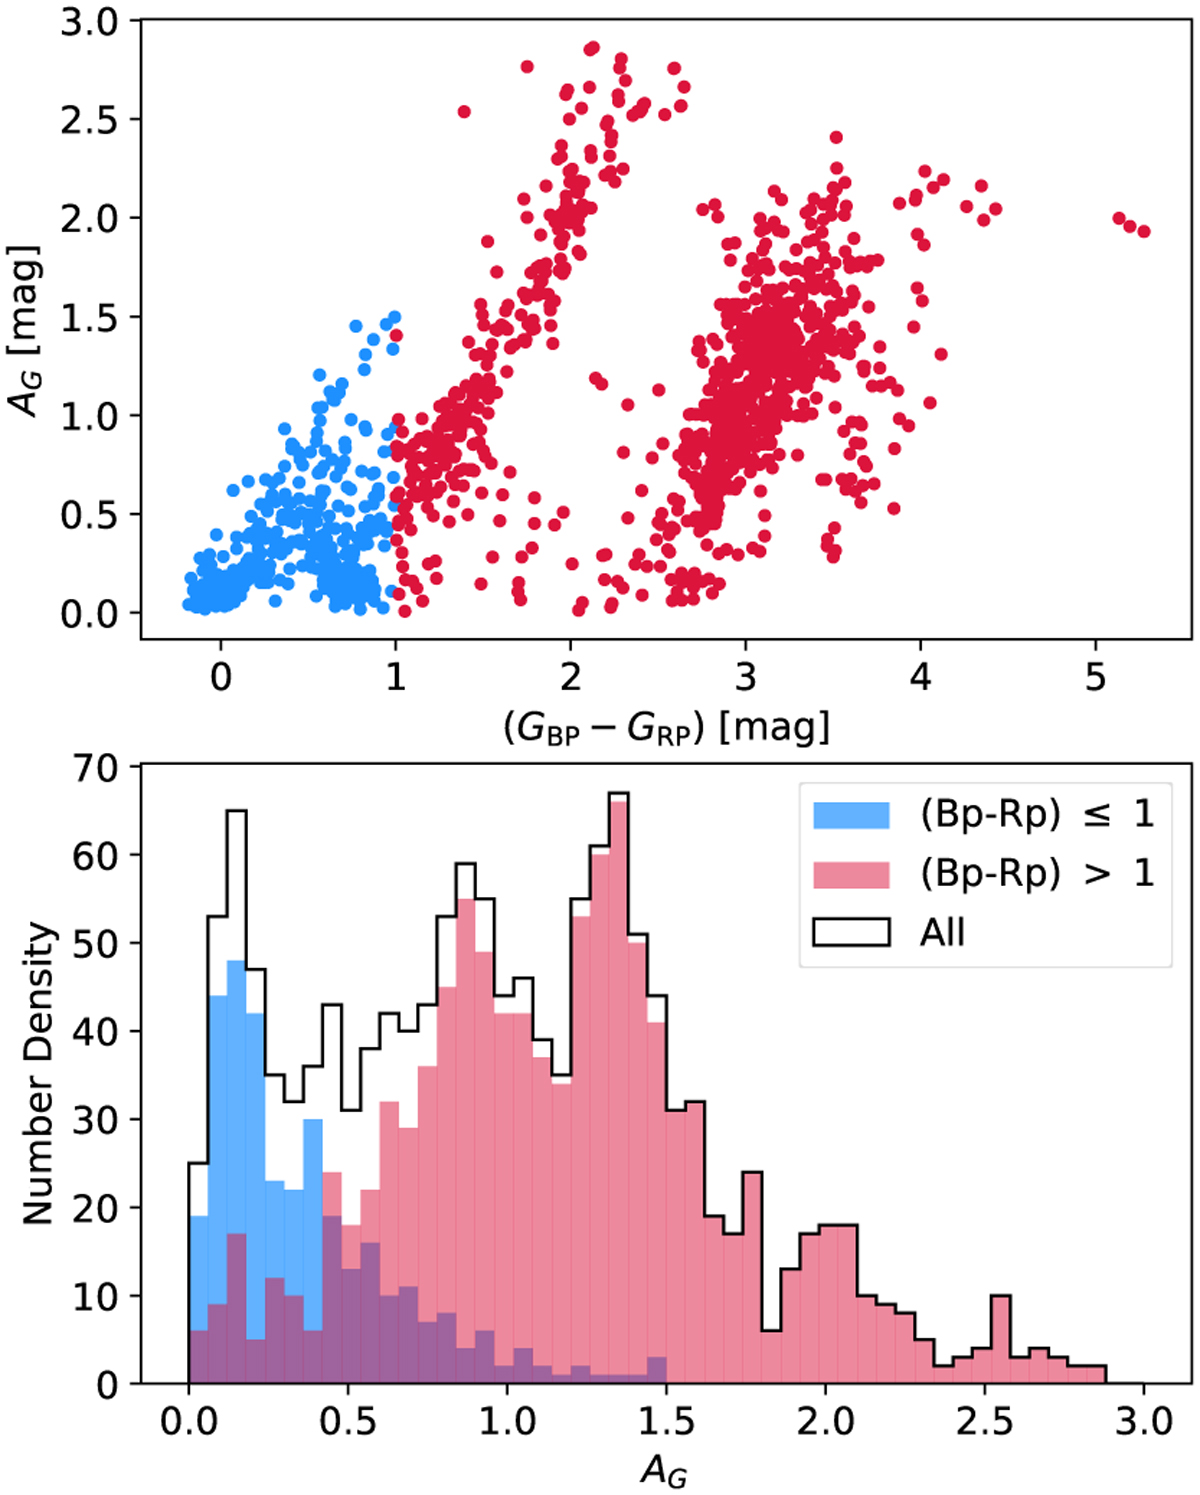
Interstellar extinction as listed in Gaia DR2. Upper panel: bimodal distribution of the extinction in the sight lines toward Sco OB2 (AG versus (GBP − GRP)). The blue branch and red branch are produced by a cut at (GBP − GRP) = 1 mag. Lower panel: histogram of AG of the blue and red branch populations.
Current usage metrics show cumulative count of Article Views (full-text article views including HTML views, PDF and ePub downloads, according to the available data) and Abstracts Views on Vision4Press platform.
Data correspond to usage on the plateform after 2015. The current usage metrics is available 48-96 hours after online publication and is updated daily on week days.
Initial download of the metrics may take a while.