Fig. 17
Download original image
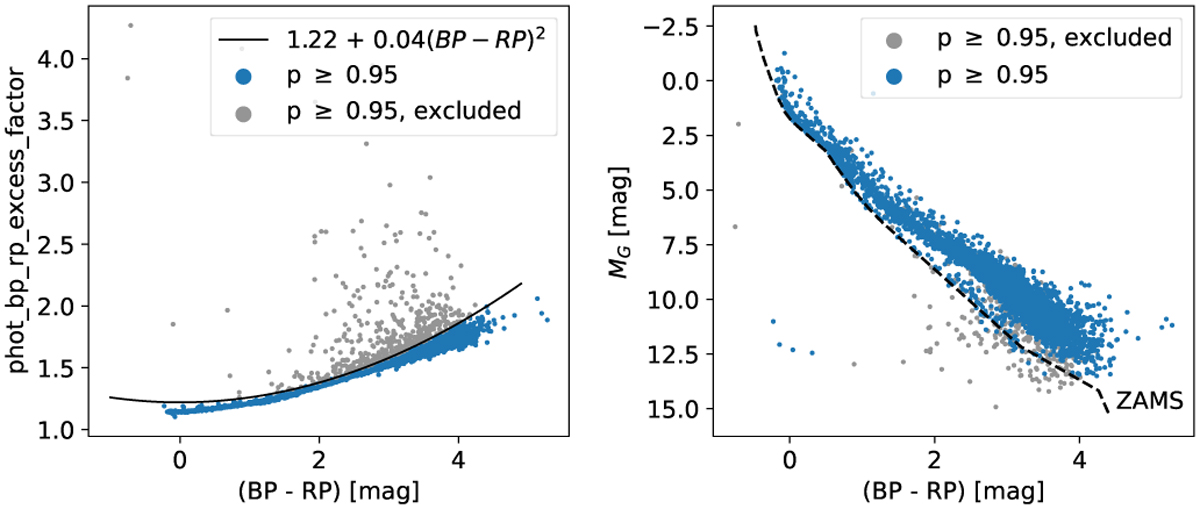
BP/RP excess filter applied to the members. Left panel: the C−(GBP − GRP) relation. The majority of stars in Sco OB2 are below the fitted curve, thus the filter C < 1.22 + 0.04(GBP − GRP)2 selects the stars with good color quality, painted in blue. The stars excluded by the filter are colored in gray. Right panel: the color-magnitude diagram after filtering. The stars that passed the filter are plotted in blue, those excluded in gray. The black dashed line indicates the zero age main sequence (ZAMS) from the PARSEC model.
Current usage metrics show cumulative count of Article Views (full-text article views including HTML views, PDF and ePub downloads, according to the available data) and Abstracts Views on Vision4Press platform.
Data correspond to usage on the plateform after 2015. The current usage metrics is available 48-96 hours after online publication and is updated daily on week days.
Initial download of the metrics may take a while.