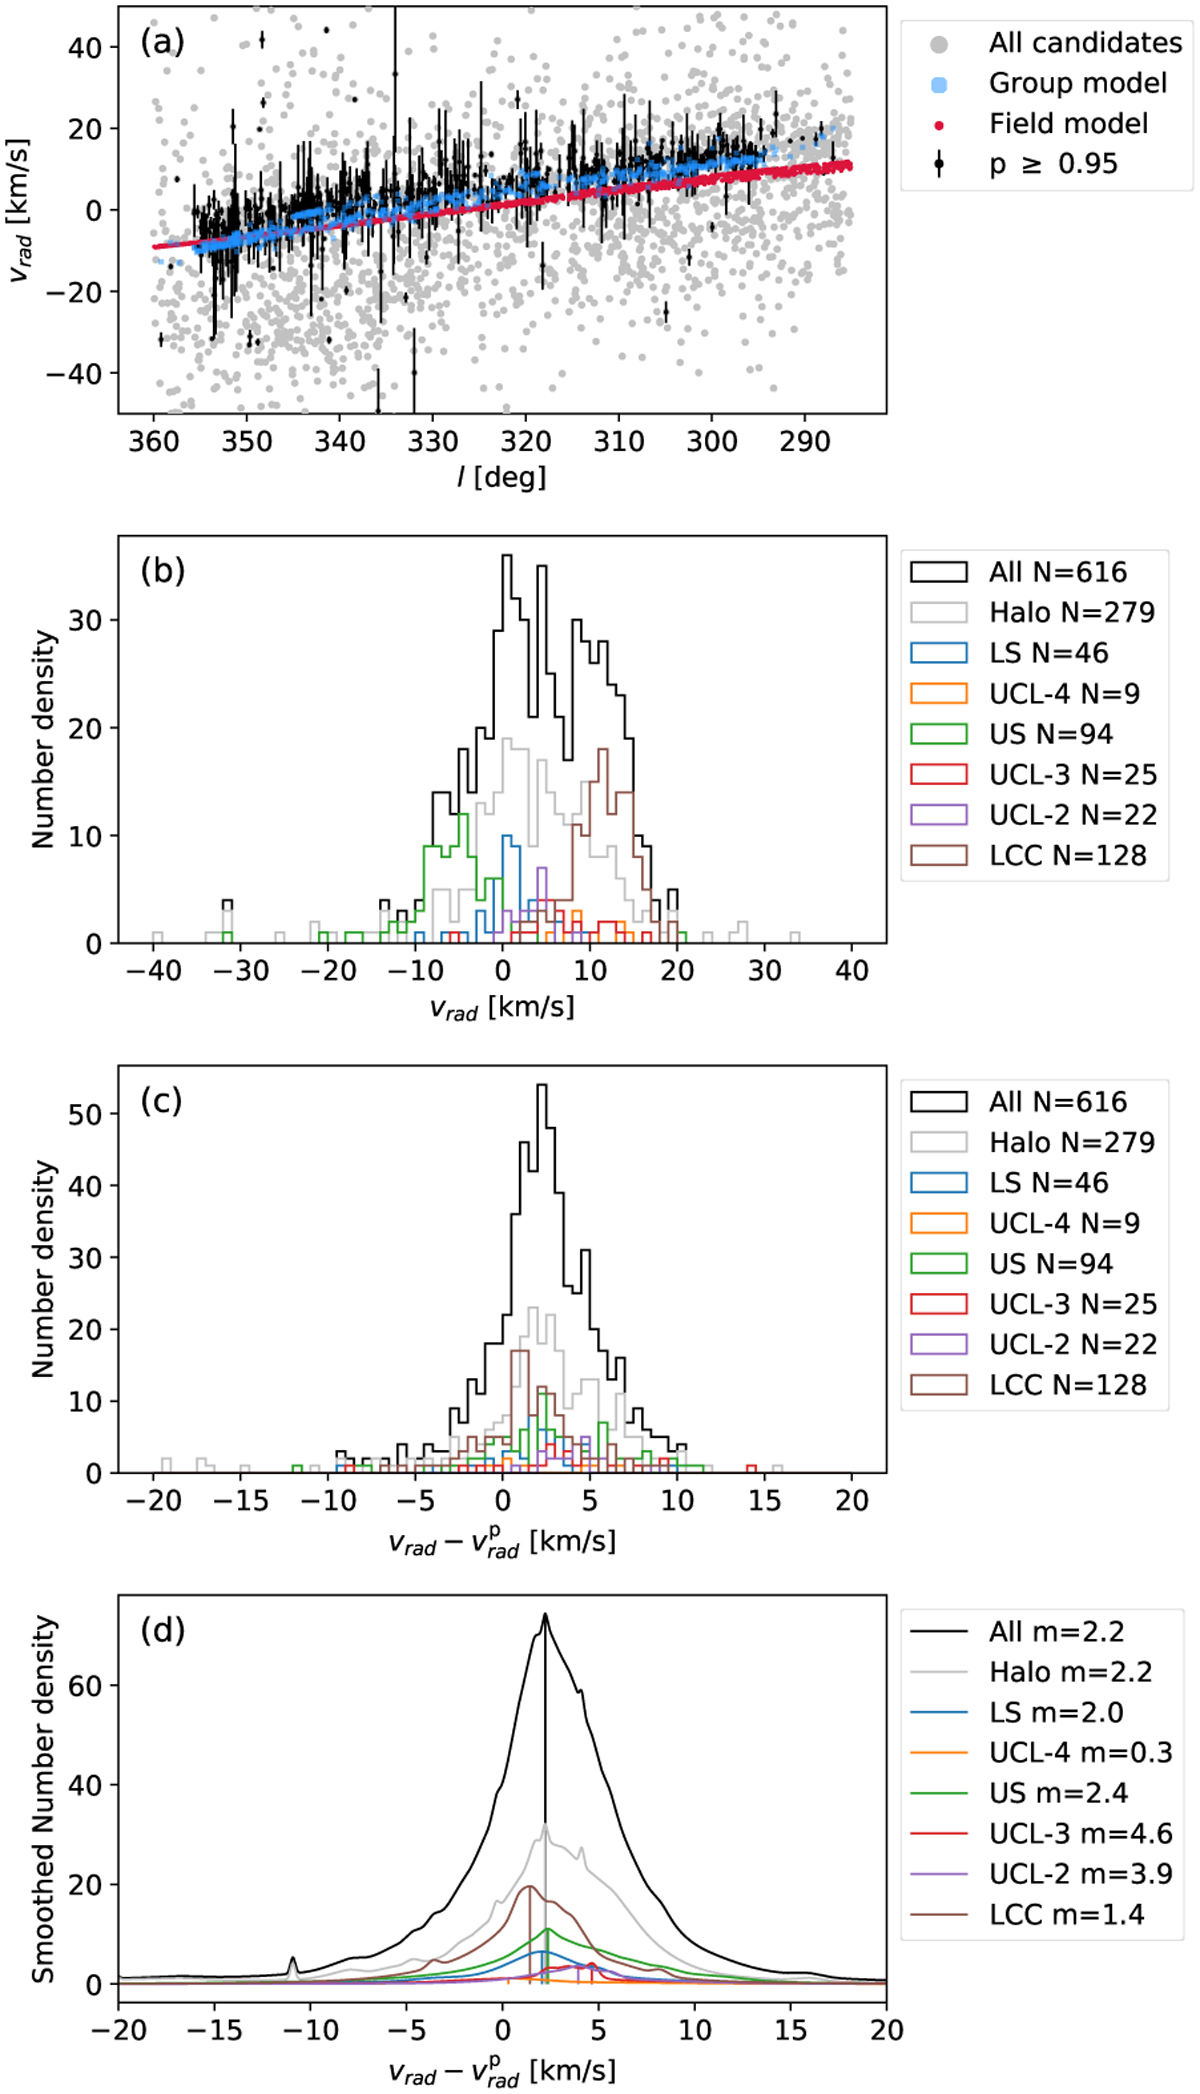
Fig. 12
Download original image
The radial-velocity dispersion per subgroup in Sco OB2. Panel a: radial velocity vrad (km s−1) plotted as a function of Galactic longitude l (deg). All the candidates with a radial velocity measurement are colored gray; all the members with black error bars. The projected group model is in blue, and the field model in red. The radial velocity range of the plots is limited to (−50, 50) km s−1, while a few candidates exceed this limit. Panel b: the histograms of observed radial velocity per subgroup. The radial velocity dispersion of Sco OB2 is inflated by the projection effect, where the majority of the radial velocities are distributed within range (−10, 20) km s−1. Panel c: radial-velocity dispersion per subgroup. The radial velocity predicted by the kinematic model has been subtracted from the measured velocity. Panel d: the radial-velocity dispersion per subgroup, smoothed with measurement errors. The peak position is marked by a vertical line, and the peak value is listed in the legend.
Current usage metrics show cumulative count of Article Views (full-text article views including HTML views, PDF and ePub downloads, according to the available data) and Abstracts Views on Vision4Press platform.
Data correspond to usage on the plateform after 2015. The current usage metrics is available 48-96 hours after online publication and is updated daily on week days.
Initial download of the metrics may take a while.