Fig. 11
Download original image
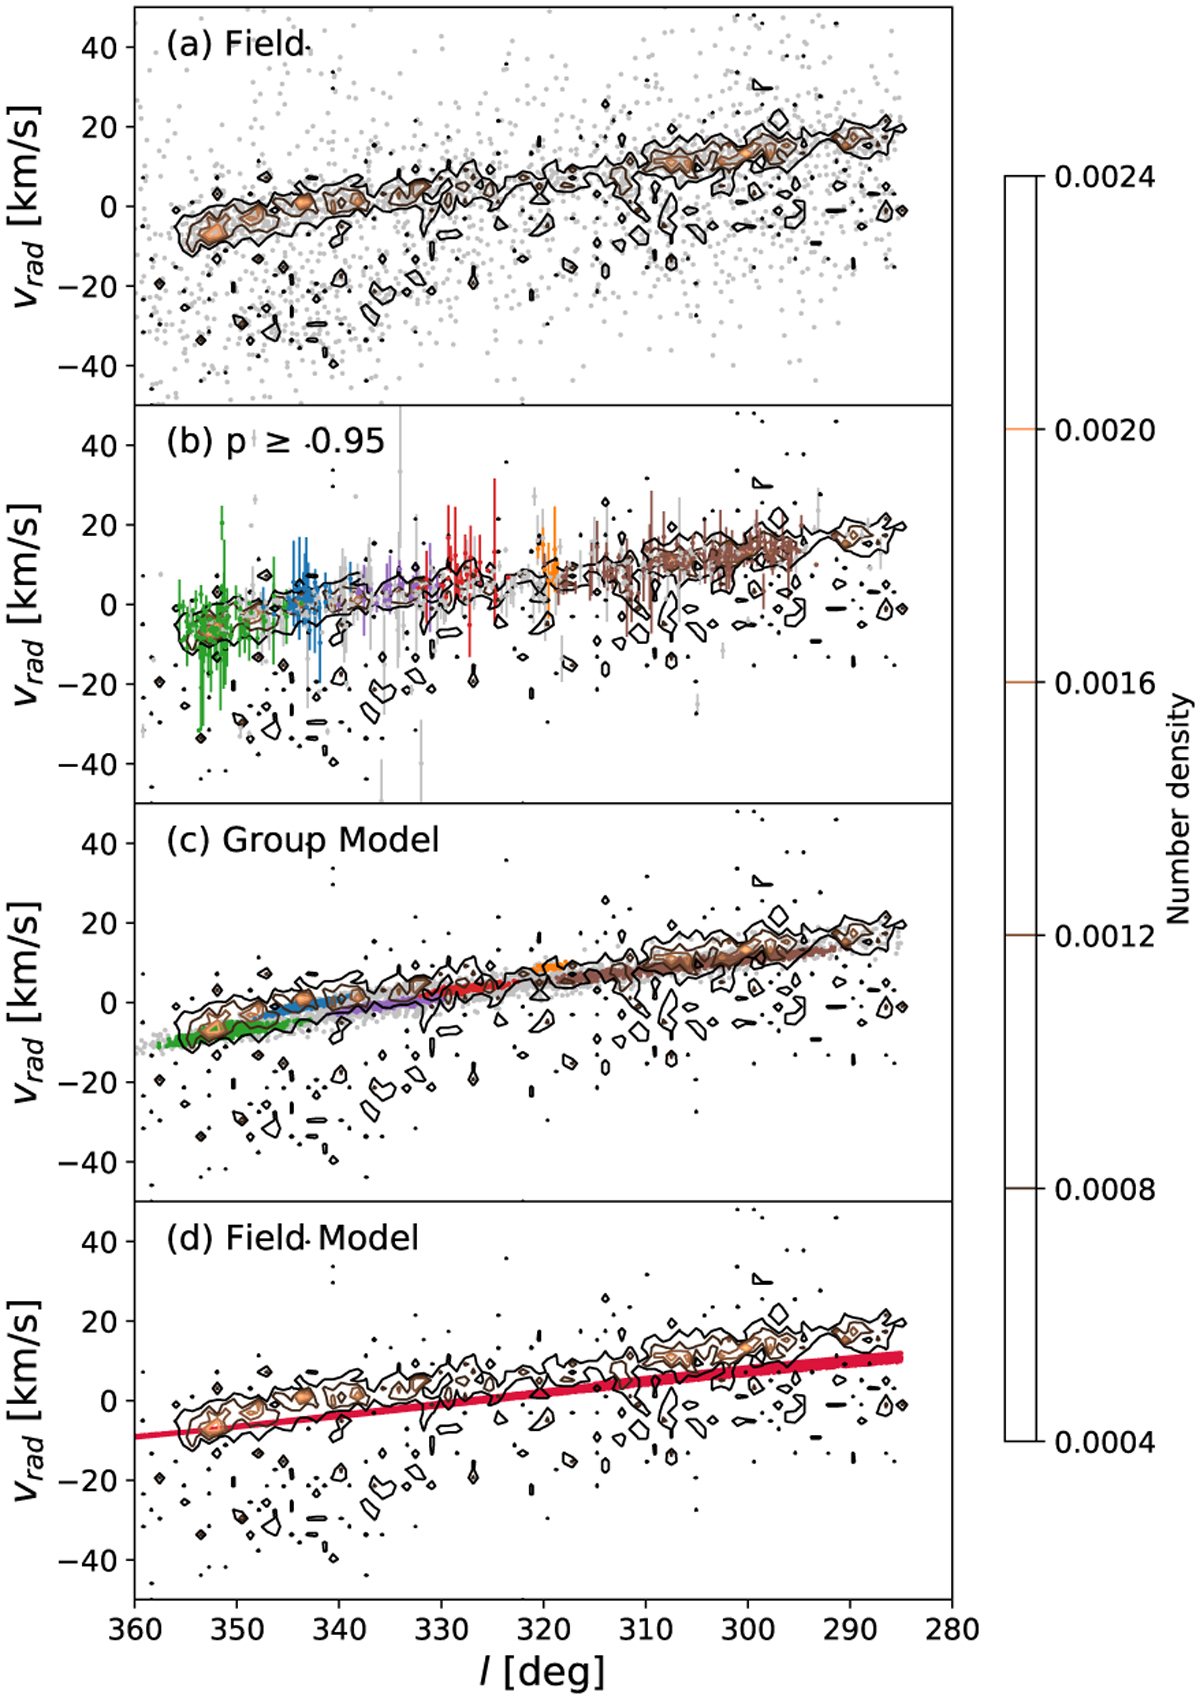
Radial velocity vrad (km s−1) plotted as a function of Galactic longitude l (deg). The panels a, b, c, and d show the radial velocity of a subset of the stellar content as in Fig. 10, but in a different parameter space. The vertical axis of the plots is cropped down to (−50, 50) km s−1, while there are a few sources whose radial velocity can reach over 100 km s−1. Within our members, only one star in US exceeds this limit at ~70 km s−1. Panel a: plot of all preselected candidates with the contours showing the density. The brighter the color, the higher the density. The high density area follows a linear relation. Panel b: the radial velocity (with error bars) of the members. The subgroups are colored as in Fig. 5. The members overlap with the high density area except for a few outliers. All subgroups together form a continuous distribution, proving again that there is no incentive to separate Sco OB2 into subgroups based on a kinematical distinction. We note that most outliers are from the Halo population (gray points with error bars). Panel c: plot of the projected group model. The model points in this space are colored the same as their corresponding subgroups. The model overlays the high density area, but has a slight shift in radial velocity relative to the observations. The shift reflects the fact that our model does not use radial velocity to constrain the optimization process. Panel d: plot of the field model (red points). It separates from the high density zone just enough to generate the group-field model contrast.
Current usage metrics show cumulative count of Article Views (full-text article views including HTML views, PDF and ePub downloads, according to the available data) and Abstracts Views on Vision4Press platform.
Data correspond to usage on the plateform after 2015. The current usage metrics is available 48-96 hours after online publication and is updated daily on week days.
Initial download of the metrics may take a while.