Fig. 10
Download original image
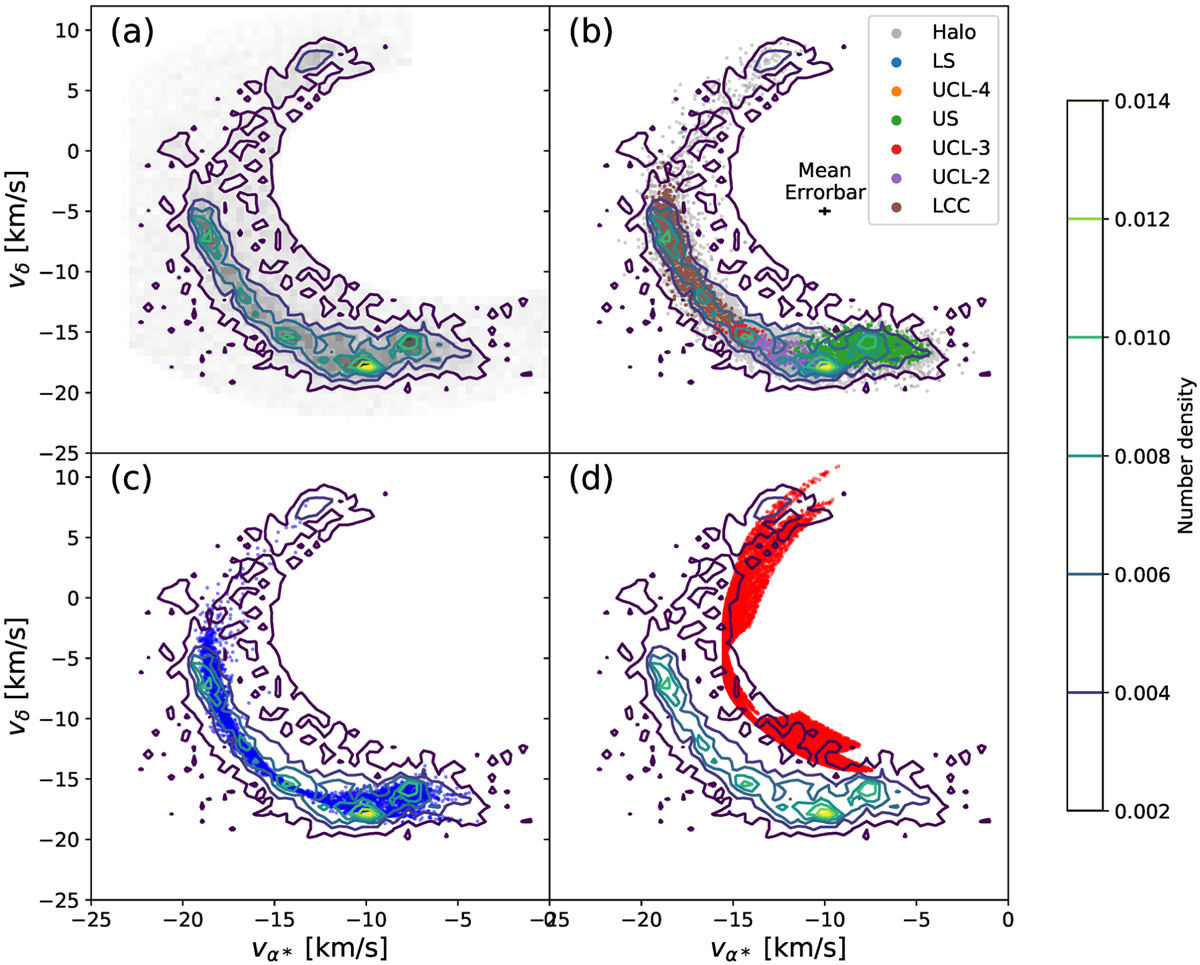
Tangential velocity distribution of Sco OB2 in vα*-vδ space. All panels contain the same contours representing the number density of all candidates after preselection. Panel a: stellar density map of all candidates in the tangential velocity space. The darker the color, the higher the density. The high density area forms a curved shape. Panel b: plot of the members where all the subgroups are colored differently. The members overlap with the high density area. The subgroups together form a continuous distribution in the tangential velocity space, thus there is no incentive to separate Sco OB2 into subgroups based on transverse velocity distinctions. The mean error bar is indicated with a black cross. The size of the mean error is ~0.3 km s−1 for both dimensions. Panel c: plot of the group model velocities, well overlapping with the high density area. The model shows that the velocity of Sco OB2 can be described as one continuous velocity field instead of multiple subgroups with distinct velocities. Panel d: plot of the field model velocities. It does not directly cover the nonmembers in this diagram, but with the help of a very large velocity dispersion (~20–100 km s−1) it is adequate to represent the nonmembers.
Current usage metrics show cumulative count of Article Views (full-text article views including HTML views, PDF and ePub downloads, according to the available data) and Abstracts Views on Vision4Press platform.
Data correspond to usage on the plateform after 2015. The current usage metrics is available 48-96 hours after online publication and is updated daily on week days.
Initial download of the metrics may take a while.