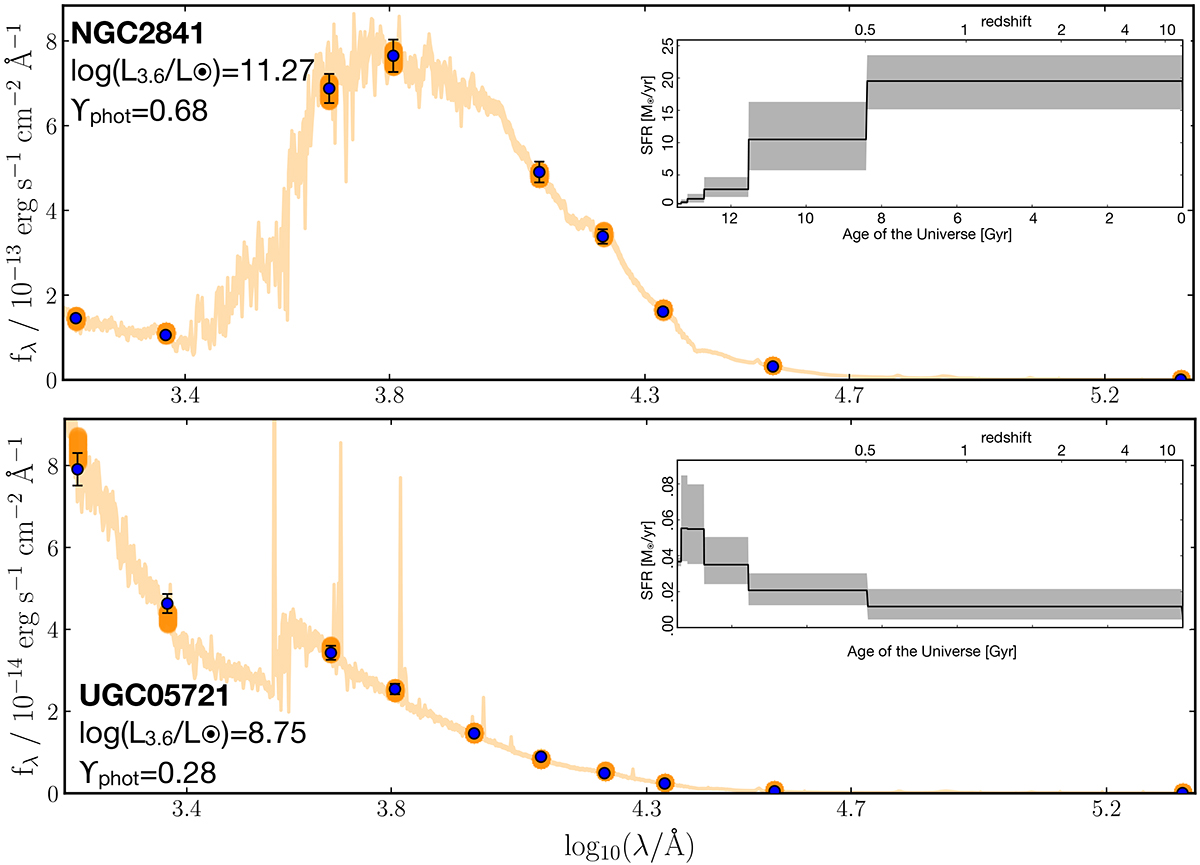
Fig. B.3.
Download original image
Two examples of our SED modelling using BAGPIPES: NGC 2841 (top) and UGC 05721 (bottom). The blue points with error bars show our measured fluxes in the various bands (FUV, NUV, g, r, z, J, H, Ks, 3.6 μm, 22 μm). The z band is used only in UGC 05721. The orange-shaded region encompasses the set of SED models that best reproduce the data, with the dark orange points showing the predicted fluxes in the same wavebands as the measurements. The insets show the SFH of the model set. The two galaxies have markedly different SFHs and corresponding values of Υphot, listed on the left side of each panel.
Current usage metrics show cumulative count of Article Views (full-text article views including HTML views, PDF and ePub downloads, according to the available data) and Abstracts Views on Vision4Press platform.
Data correspond to usage on the plateform after 2015. The current usage metrics is available 48-96 hours after online publication and is updated daily on week days.
Initial download of the metrics may take a while.