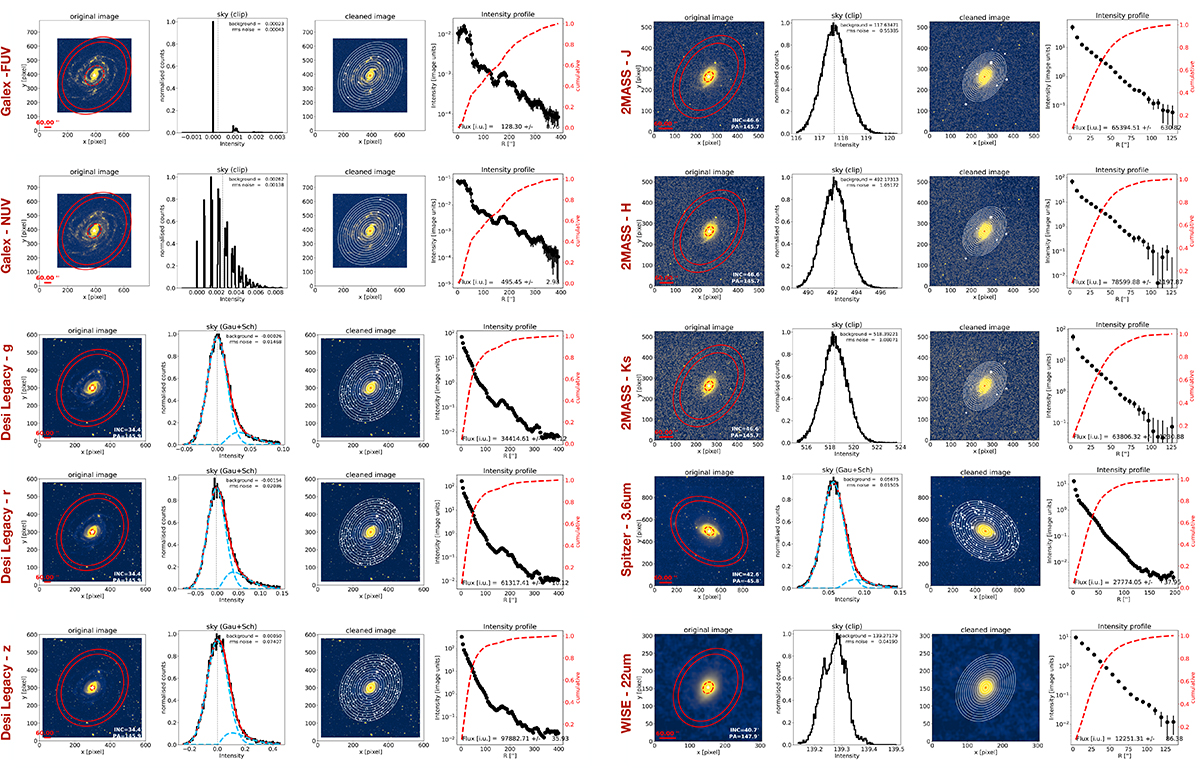
Fig. A.1.
Download original image
Photometric analysis of NGC 289. Results for each waveband are displayed in two pairs of adjacent panels. First panel: original image. The two red ellipses enclose the region where the sky properties are computed. Second panel: pixel intensity distribution within the sky region (black histogram). The vertical dotted line indicates the estimated sky background value. The red curve (present only in some bands) shows the best-fit sky model made by the sum of a Gaussian and a Schechter component (see M23), individually shown by dashed light blue curves. UV bands suffer from low photon counts. Third panel: image filtered with our point-source masking technique. The division in concentric rings is also shown. Fourth panel: final radial intensity profile in image units (black circles with error bars) and normalised growth curve (red dashed curve).
Current usage metrics show cumulative count of Article Views (full-text article views including HTML views, PDF and ePub downloads, according to the available data) and Abstracts Views on Vision4Press platform.
Data correspond to usage on the plateform after 2015. The current usage metrics is available 48-96 hours after online publication and is updated daily on week days.
Initial download of the metrics may take a while.