Fig. 1.
Download original image
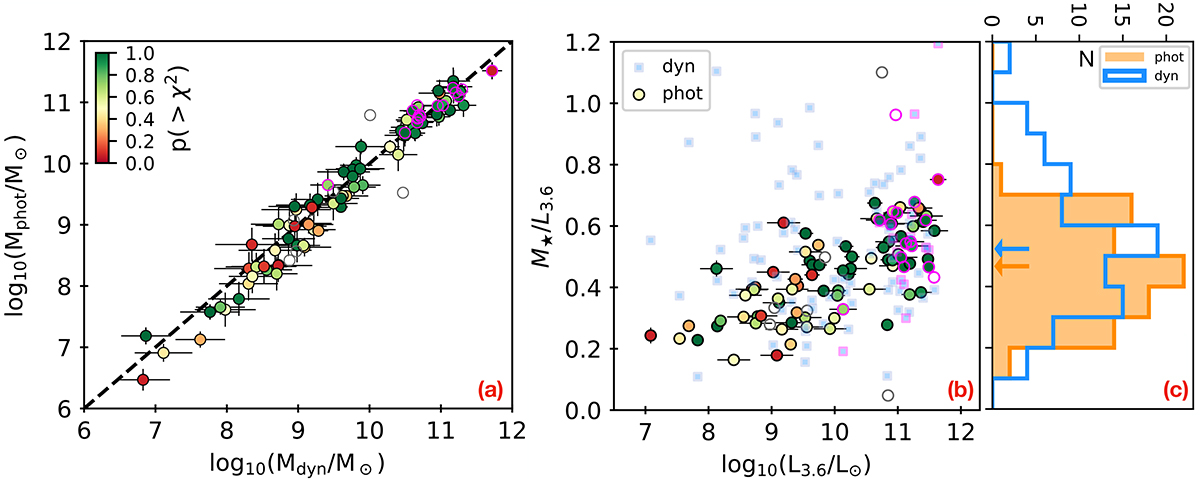
(a)–Mphot vs. Mdyn for 95 galaxies in the SPARC sample, colour-coded by p(> χ2). Empty circles show galaxies with poor SED fits: p(> χ2)< 0.05. (b)–Υdyn (light blue squares) and Υphot (filled circles, colour-coded as in panel a) vs. L3.6. Error bars on Υdyn, not displayed for clarity, vary from ±0.3 for the faintest galaxies to ±0.1 for the brightest. Υphot increases gradually from ∼0.2 to ∼0.7 across more than 4 dex in L3.6. (c)–Distribution of Υphot (orange-filled histogram) and Υdyn (blue empty histogram). Galaxies with poor SED fits have been removed. The arrows show the medians of the distributions. The purple-edged circles in panels a and b show systems with fb > 0.2.
Current usage metrics show cumulative count of Article Views (full-text article views including HTML views, PDF and ePub downloads, according to the available data) and Abstracts Views on Vision4Press platform.
Data correspond to usage on the plateform after 2015. The current usage metrics is available 48-96 hours after online publication and is updated daily on week days.
Initial download of the metrics may take a while.