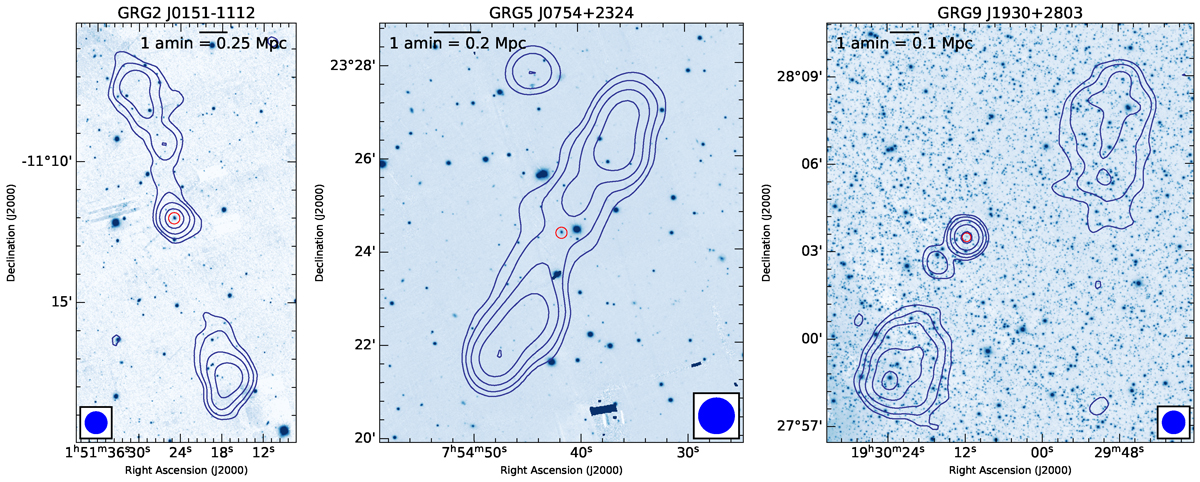
Fig. 2.
Download original image
Montage of new GRGs: Each GRG shown in the NVSS contours overlay on the PanSTARRS-DR1 r-band map. The Pan-STARRS images are presented in colour map while the NVSS contours are plotted at 1.35 mJy beam−1 × 2n (n = 0, 1, 2, 3...) for all the maps. The beam size (in blue colour) is placed in the bottom right or left corner, and the host galaxy position is marked as a red circle for each map. The angular length scale is given in the corners of the relevant figures.
Current usage metrics show cumulative count of Article Views (full-text article views including HTML views, PDF and ePub downloads, according to the available data) and Abstracts Views on Vision4Press platform.
Data correspond to usage on the plateform after 2015. The current usage metrics is available 48-96 hours after online publication and is updated daily on week days.
Initial download of the metrics may take a while.