Fig. 7
Download original image
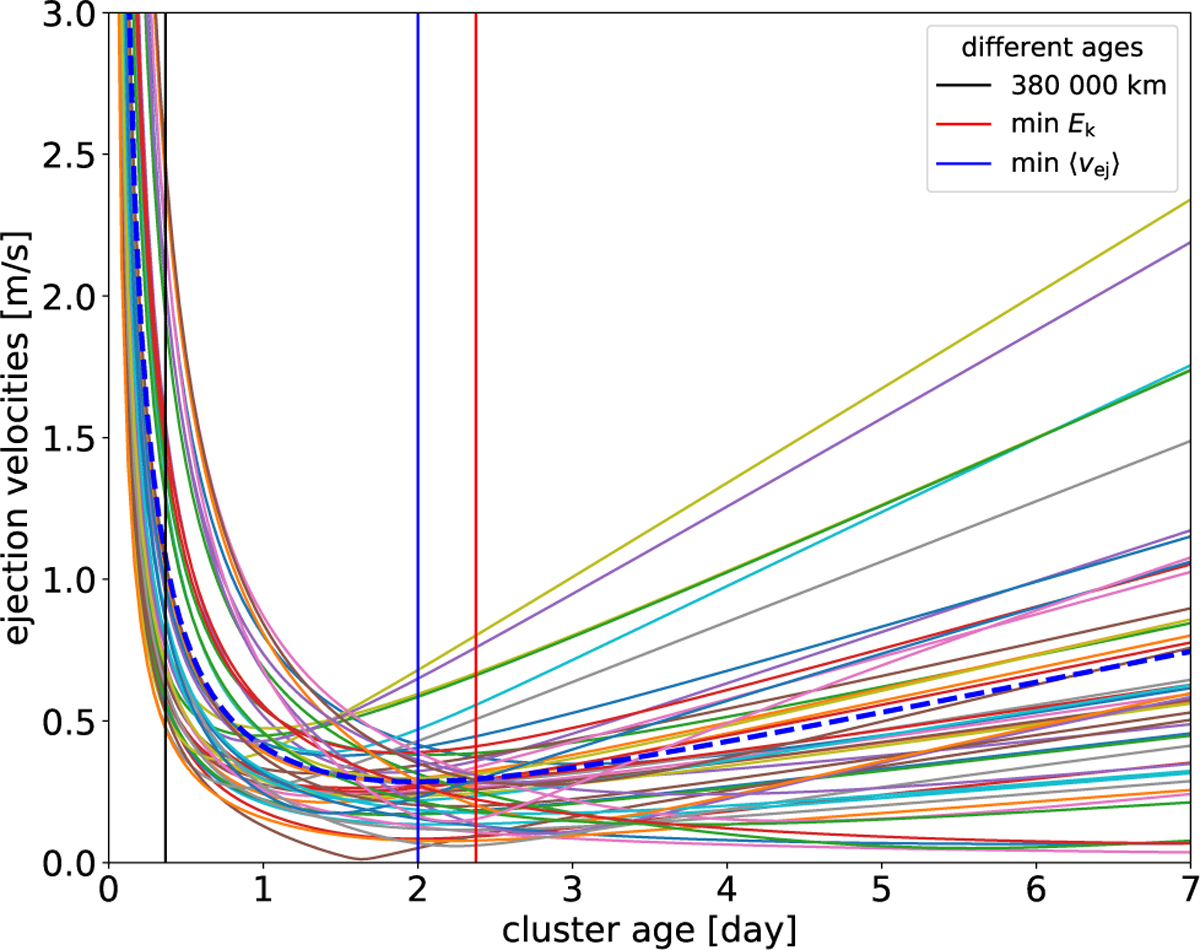
Dependence of ejection velocities of individual fragments on cluster age (solid curves). The dashed blue curve corresponds to the mean ejection velocity. The vertical lines correspond to different ages: the age determined from the minimum of the initial kinetic energy of all fragments is ∼2.4 days (red line), while the minimum of the mean ejection velocity corresponds to an age of ∼2.0 days (blue line). The age corresponding to the formation at the distance of the semi-major axis of the Moon's orbit (∼9 hours) is shown in black.
Current usage metrics show cumulative count of Article Views (full-text article views including HTML views, PDF and ePub downloads, according to the available data) and Abstracts Views on Vision4Press platform.
Data correspond to usage on the plateform after 2015. The current usage metrics is available 48-96 hours after online publication and is updated daily on week days.
Initial download of the metrics may take a while.