Fig. 5
Download original image
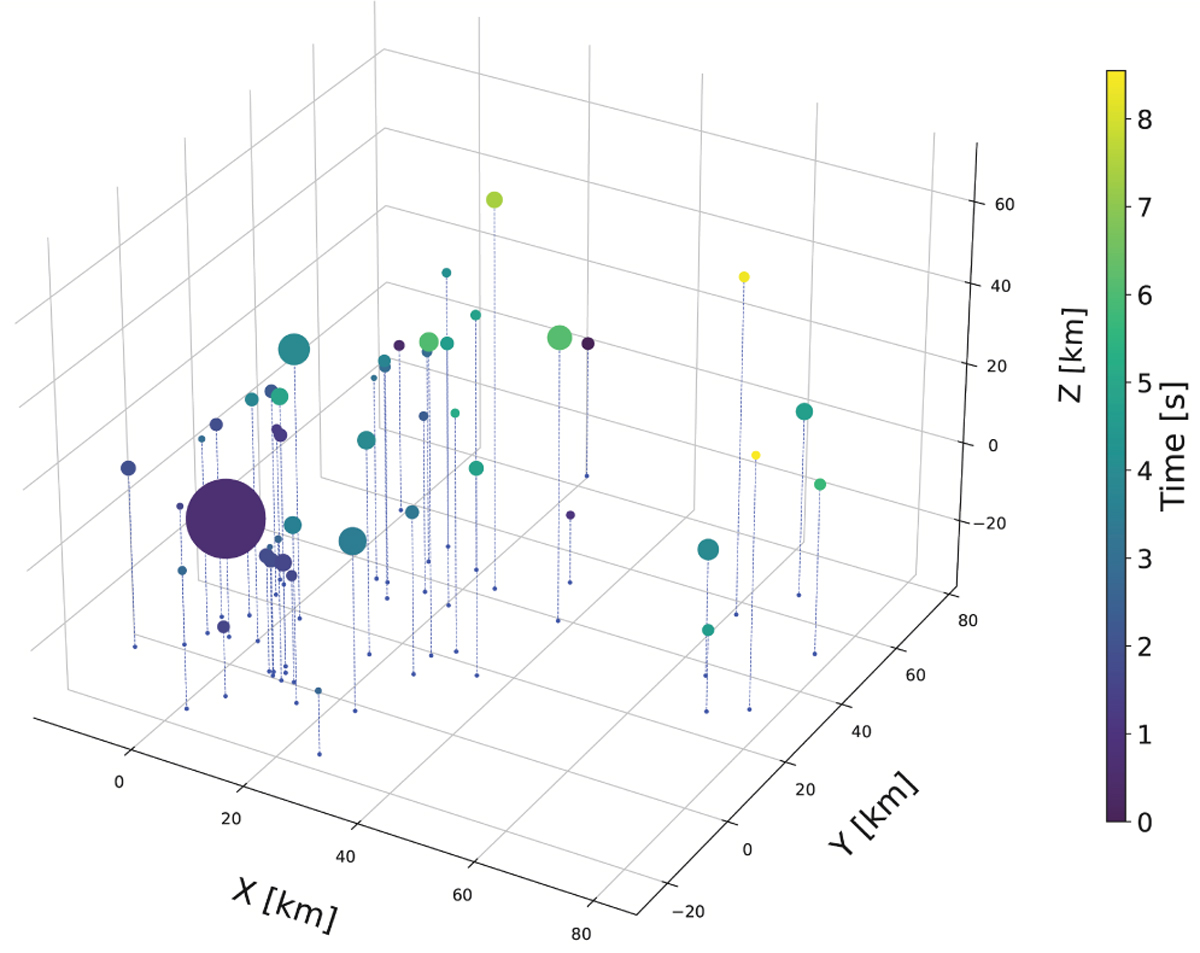
Real positions of the fragments with respect to the largest one in the co-ordinate system, where the x axis is pointed in the antisolar direction and the z axis points to the northern ecliptic pole. The size of each symbol is proportional to the mass of the fragment. Again, the start time of each meteor is colour-coded. For better illustration, a 'ground' projection of the fragments is marked with dashed blue lines.
Current usage metrics show cumulative count of Article Views (full-text article views including HTML views, PDF and ePub downloads, according to the available data) and Abstracts Views on Vision4Press platform.
Data correspond to usage on the plateform after 2015. The current usage metrics is available 48-96 hours after online publication and is updated daily on week days.
Initial download of the metrics may take a while.