Fig. 4
Download original image
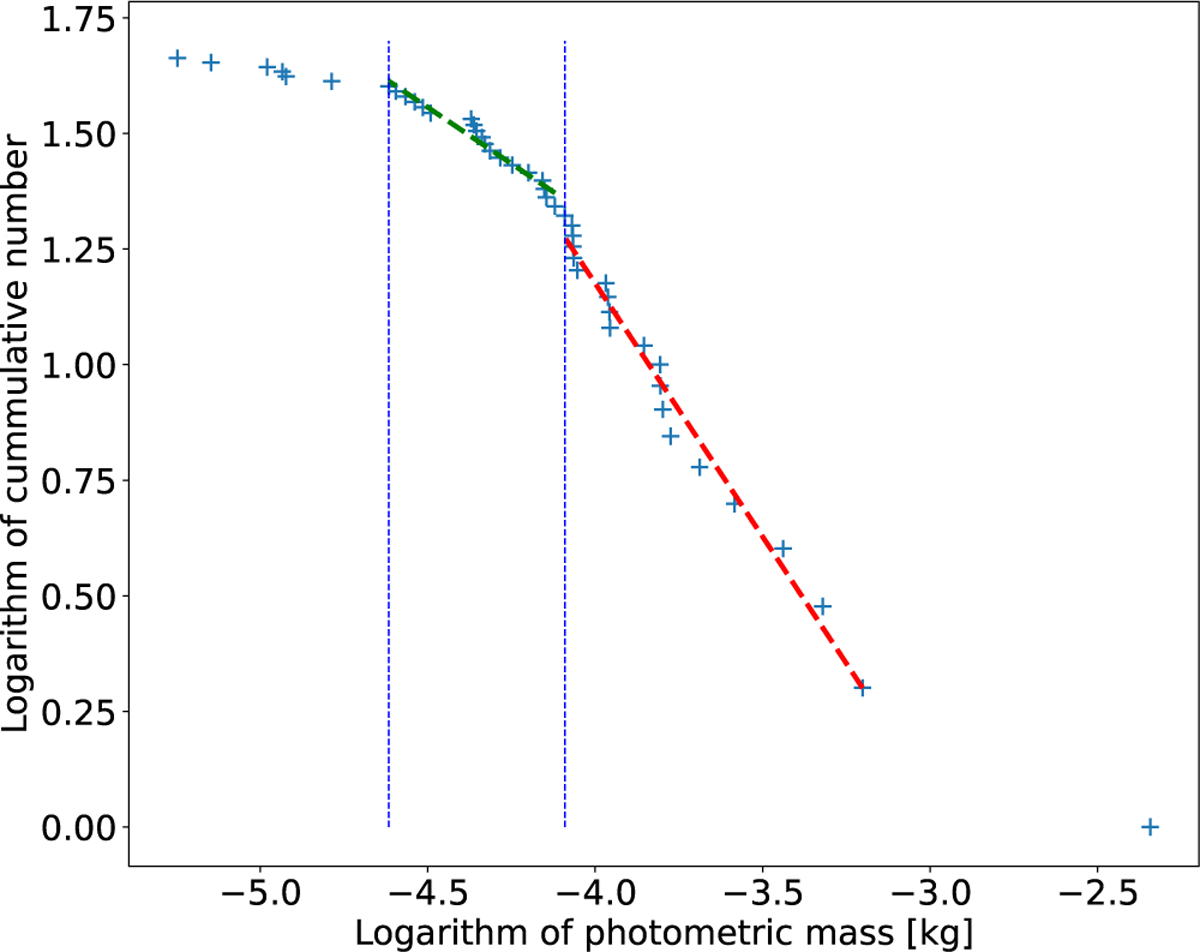
Cumulative distribution of the cluster meteor masses. The dashed red line represents a linear part of the plot, which is fitted with a line of slope k = −1.10 and which was used for the calculation of the mass distribution index. The dashed green line fits masses between 0.02 g and 0.08 g. These limits, used to calculate the total mass of the cluster, are marked by vertical dashed blue lines. The slope of this line is k = −0.49.
Current usage metrics show cumulative count of Article Views (full-text article views including HTML views, PDF and ePub downloads, according to the available data) and Abstracts Views on Vision4Press platform.
Data correspond to usage on the plateform after 2015. The current usage metrics is available 48-96 hours after online publication and is updated daily on week days.
Initial download of the metrics may take a while.