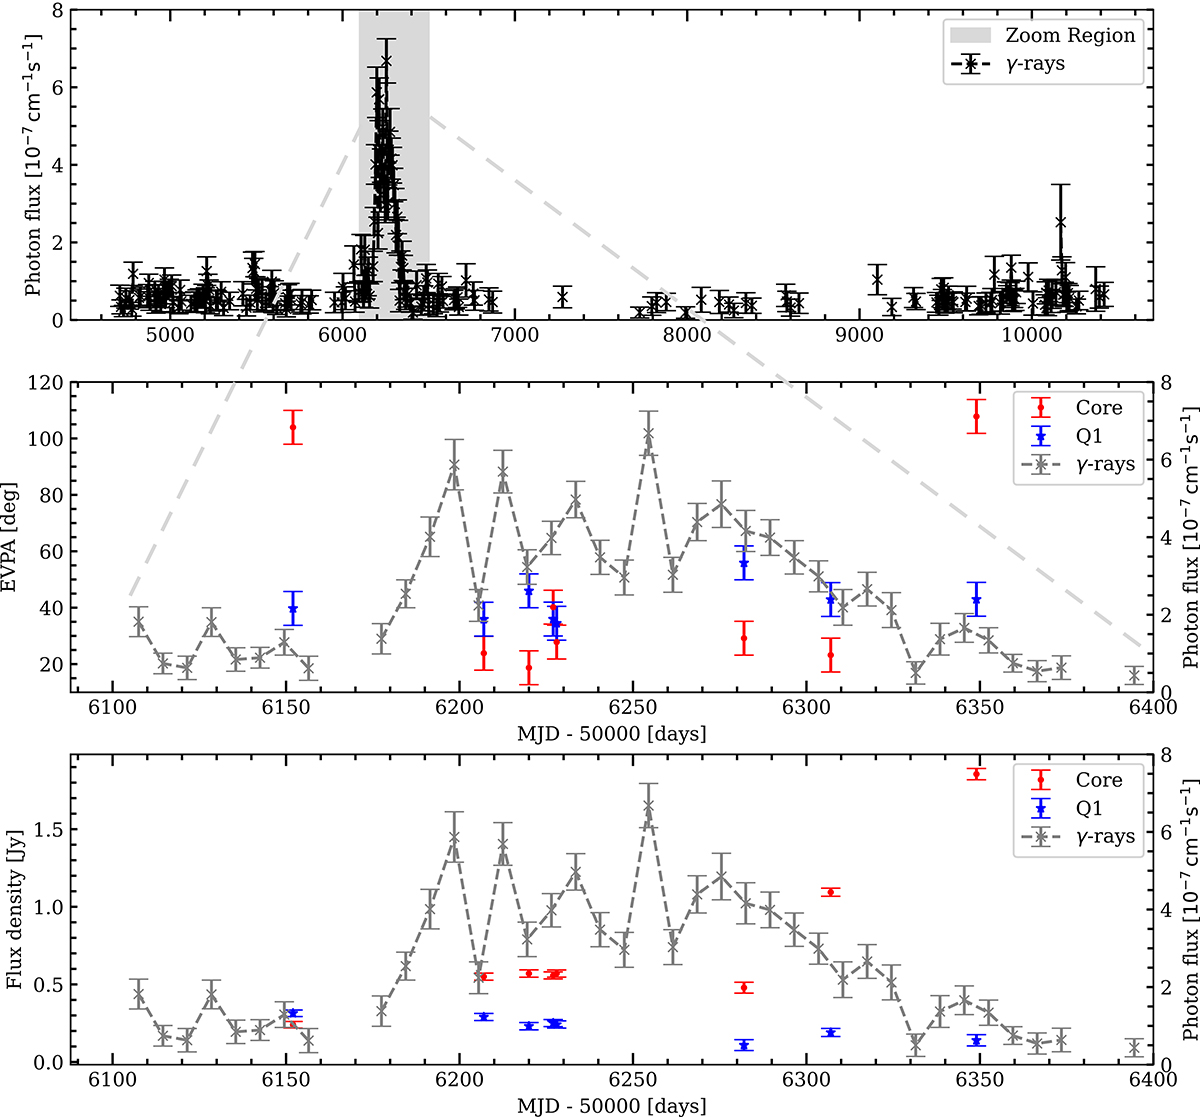
Fig. 2.
Download original image
OJ 248 component EVPAs and flux density, and the Fermi-LAT γ-ray light curve. In the top panel, the grey-shaded area marks the period in question, when the prominent γ-ray flare occurred. In the years since, the source has remained quiescent. The middle panel shows a zoomed-in view of the γ-ray flare time frame (grey-shaded area of the top panel), revealing a multi-peak profile. Additionally, the EVPAs in C (red) and Q1 (blue) were perpendicular to each other immediately before and after the γ-ray flare, but then rotated to be aligned during the flaring event. The bottom panel shows the same zoomed-in region but with the flux density of C denoted in red and that for Q1 in blue. We see an increasing trend in C.
Current usage metrics show cumulative count of Article Views (full-text article views including HTML views, PDF and ePub downloads, according to the available data) and Abstracts Views on Vision4Press platform.
Data correspond to usage on the plateform after 2015. The current usage metrics is available 48-96 hours after online publication and is updated daily on week days.
Initial download of the metrics may take a while.