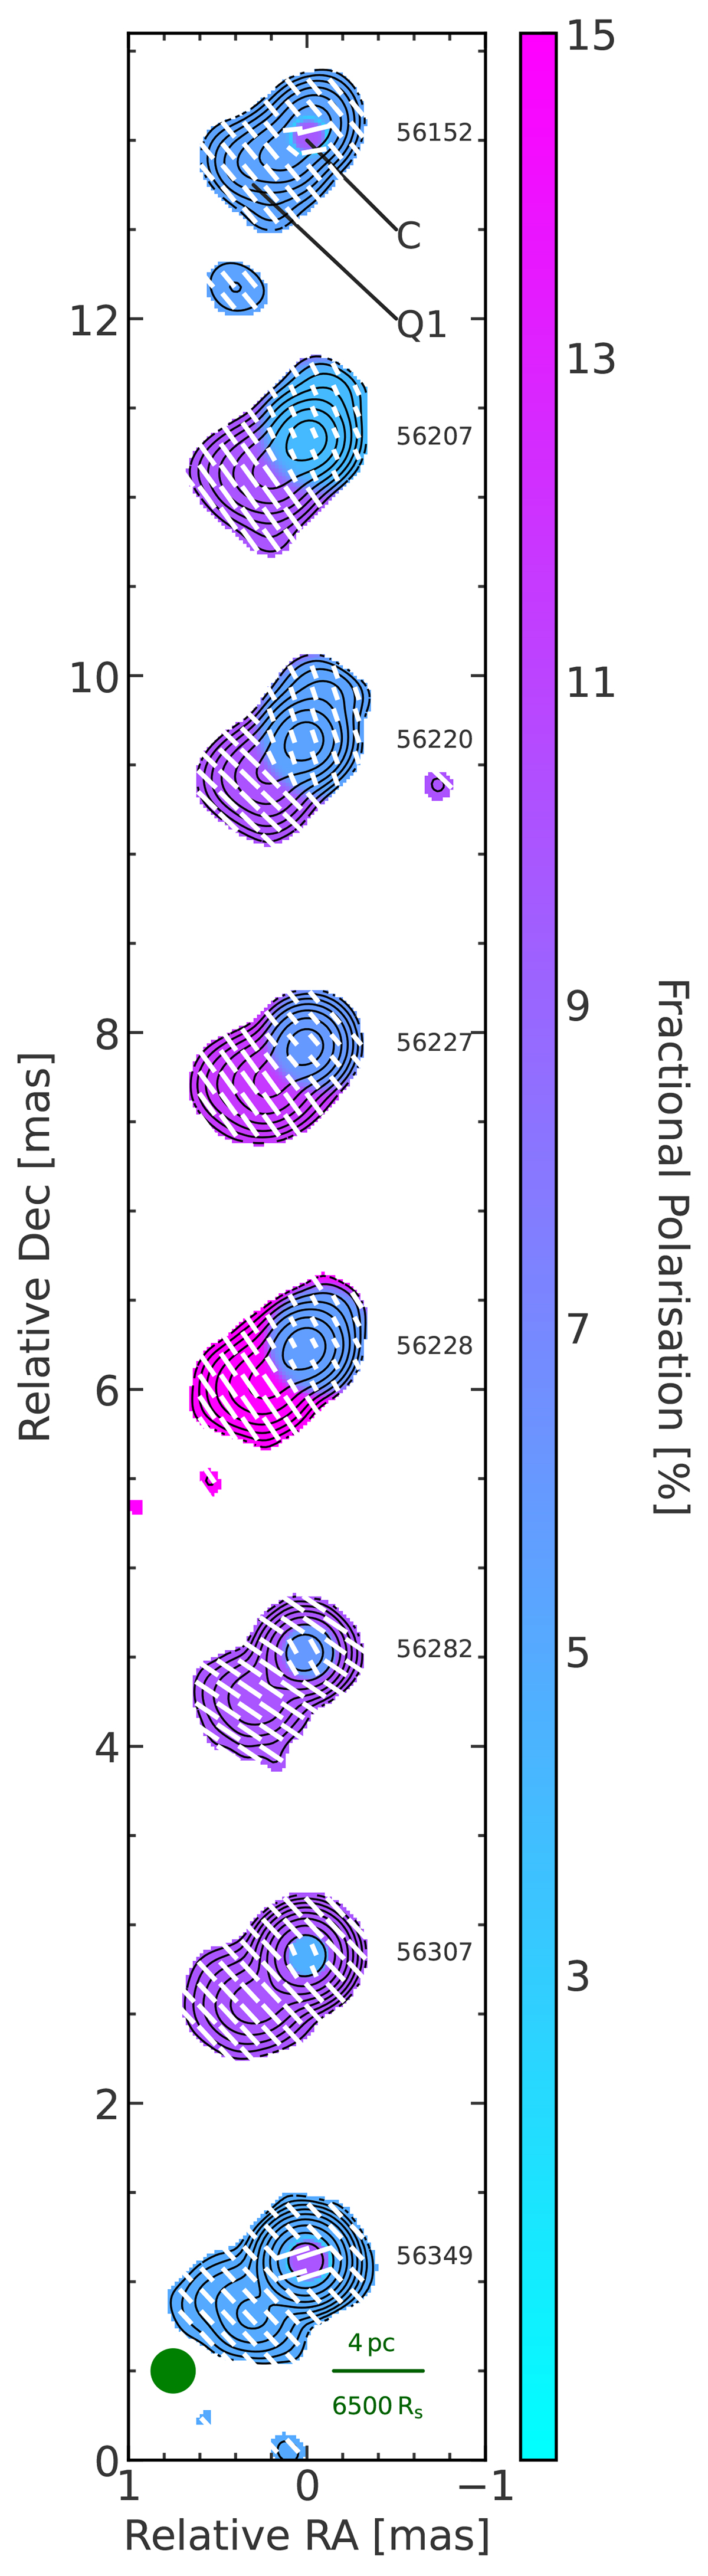
Fig. 1.
Download original image
Stokes I image (contours) and fractional polarisation geometrical model-fit (colour) of OJ 248 showcasing the epochs close in time to the MJD 56152–56349 (year: 2012−2013) γ-ray flare. The colour scale is linear, and the units are in percent. The dark green ellipse in the lower-left corner shows the common convolving circular beam size of 0.24 mas. The green bar (bottom right) corresponds to a projected distance of 6500 RS (Schwarzschild radius). Superimposed are the EVPAs (white sticks), showcasing the direction of the electric field and by extension that of the magnetic field (perpendicular). Their length is proportional to the fractional polarisation values. The lowest Stokes I contour cutoff at 5σI was implemented to only include high-S/N areas (with σI = 0.71 mJy/beam). The contour levels are at 0.25, 0.5, 1, 2, 4, 8, 16, 32, and 64% of the total intensity peak per epoch, the MJDs of which are denoted next to each observation. The core (C) and component Q1 are denoted in the first epoch. The EVPAs in C start out along the bulk jet flow (south-east direction). As the shock front progresses downstream, they exhibit a clear turn, becoming perpendicular to the bulk jet flow and aligned to the EVPAs in Q1.
Current usage metrics show cumulative count of Article Views (full-text article views including HTML views, PDF and ePub downloads, according to the available data) and Abstracts Views on Vision4Press platform.
Data correspond to usage on the plateform after 2015. The current usage metrics is available 48-96 hours after online publication and is updated daily on week days.
Initial download of the metrics may take a while.