Open Access
Fig. 4
Download original image
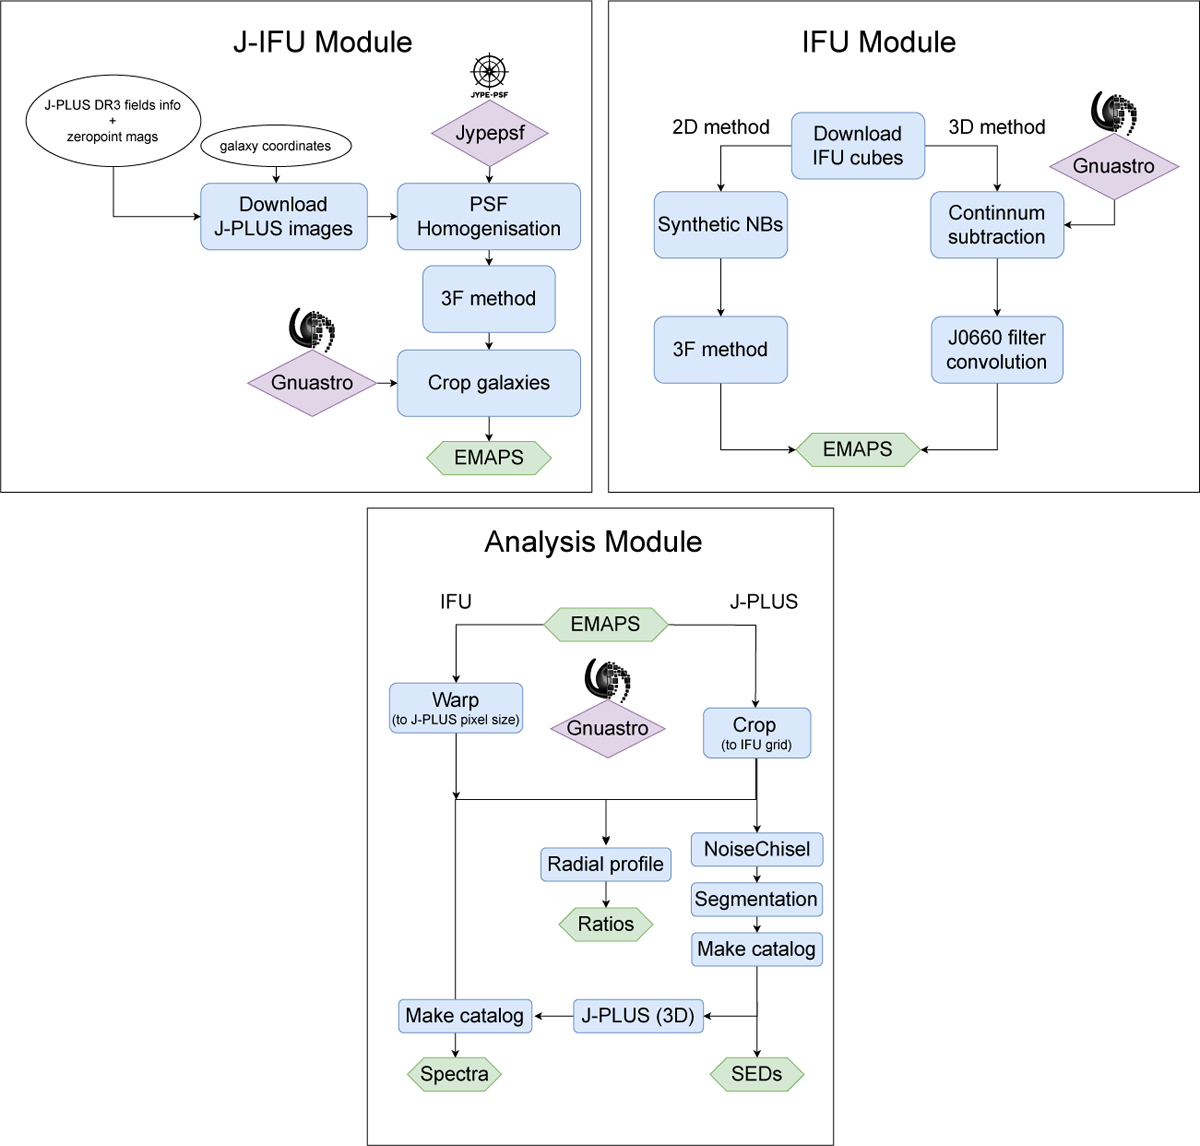
Flowchart of the J-SHE modules. Top left: J-IFU module. Top right: IFU module. Bottom: analysis module. White ellipses are inputs, purple blocks are external packages, blue boxes indicate different processes, and green hexagons represent outputs.
Current usage metrics show cumulative count of Article Views (full-text article views including HTML views, PDF and ePub downloads, according to the available data) and Abstracts Views on Vision4Press platform.
Data correspond to usage on the plateform after 2015. The current usage metrics is available 48-96 hours after online publication and is updated daily on week days.
Initial download of the metrics may take a while.