Fig. 10
Download original image
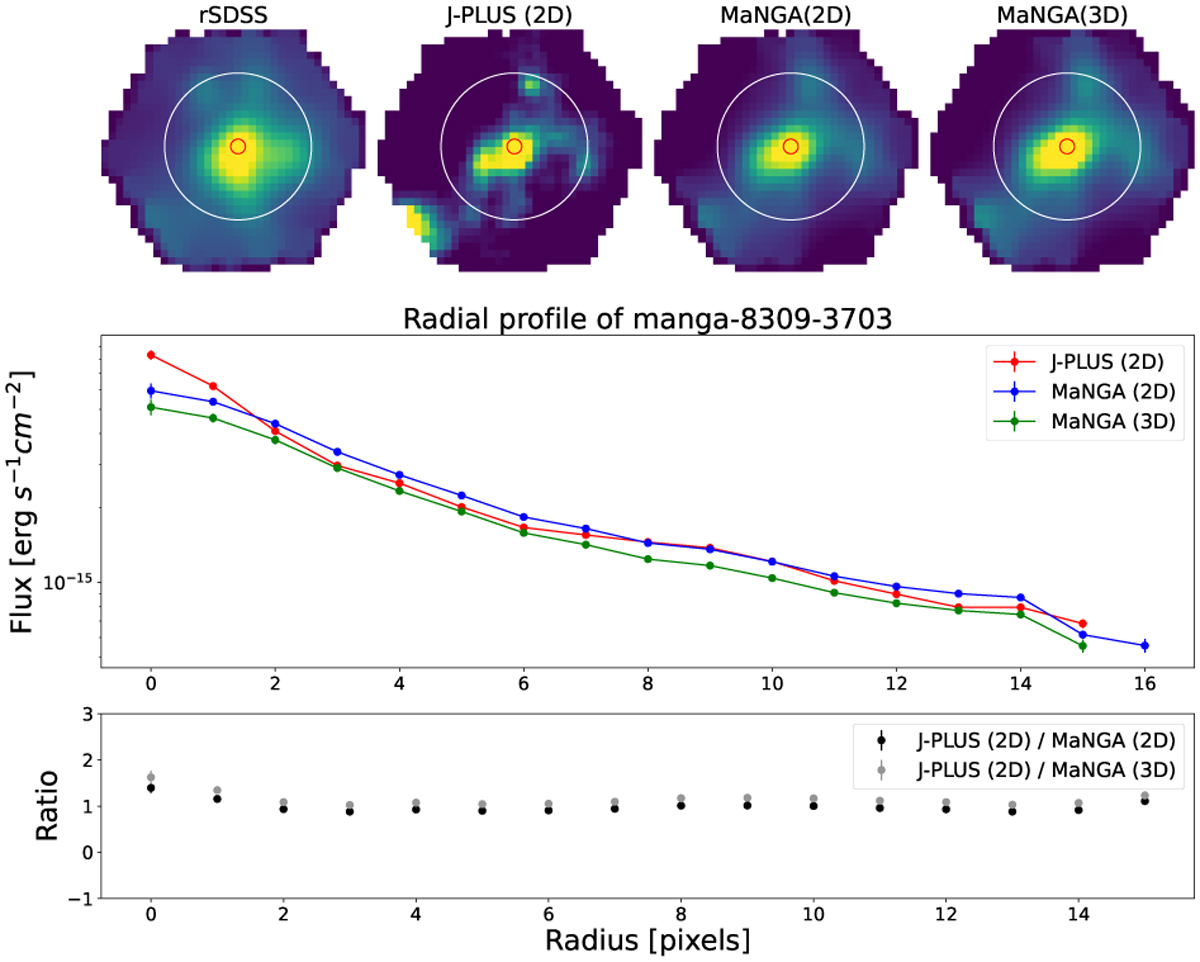
Upper: rSDSS, J-PLUS (2D), MaNGA (2D), and MaNGA (3D) Hα+[NII] map of MaNGA-8309–3703 (the white circle is in a 10 pixel radius). Middle: radial profiles of Hα+[NII] maps from J-PLUS (2D), MaNGA (2D) and MaNGA (3D). Lower: the ratio of the radial profiles between J-PLUS and MaNGA Hα+[NII] maps. Note that emaps are in the same scale except rSDSS.
Current usage metrics show cumulative count of Article Views (full-text article views including HTML views, PDF and ePub downloads, according to the available data) and Abstracts Views on Vision4Press platform.
Data correspond to usage on the plateform after 2015. The current usage metrics is available 48-96 hours after online publication and is updated daily on week days.
Initial download of the metrics may take a while.