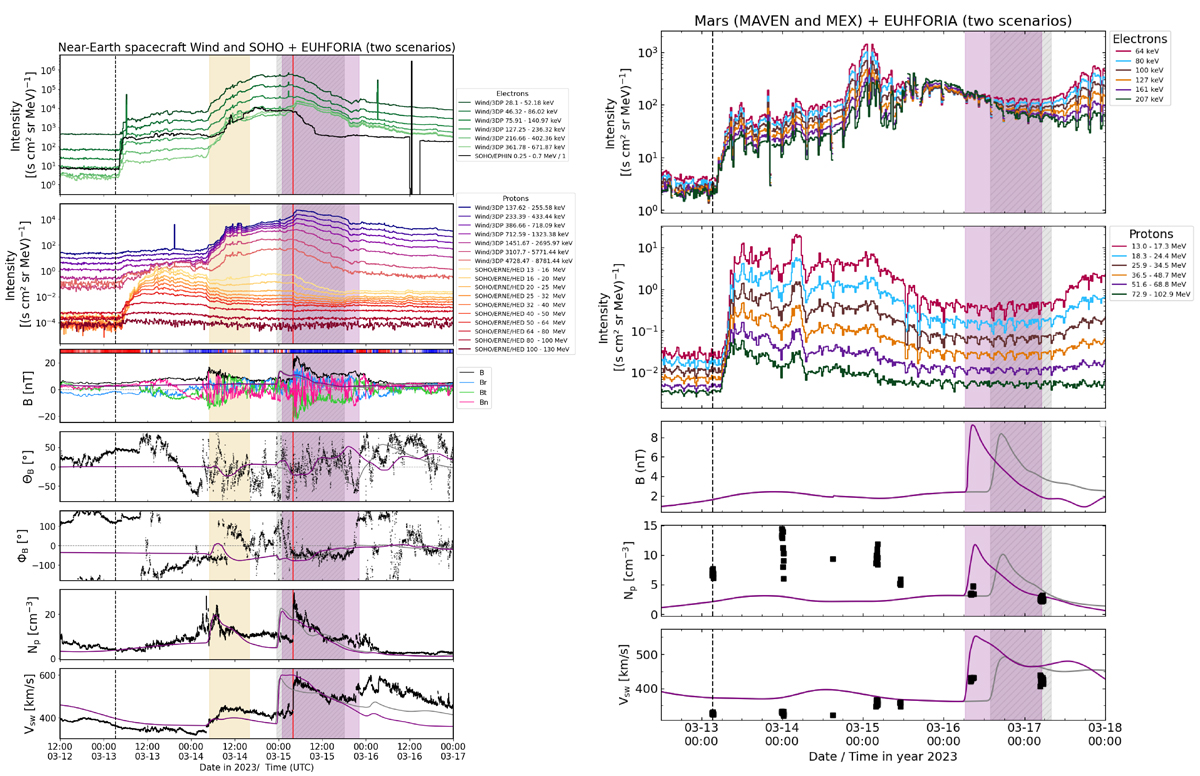
Fig. 6.
Download original image
In situ observations in comparison with EUHFORIA simulation results for near-Earth S/C (left) and at Mars (right). Same format as in Fig. 5. At Mars energetic particle fluxes were measured by MAVEN and the solar wind speed and density were measured by the Mars Express mission (MEX). The gray shade in the Mars plot represents the CME arrival time based on the pre-event CME simulation, is the CME of the main eruption.
Current usage metrics show cumulative count of Article Views (full-text article views including HTML views, PDF and ePub downloads, according to the available data) and Abstracts Views on Vision4Press platform.
Data correspond to usage on the plateform after 2015. The current usage metrics is available 48-96 hours after online publication and is updated daily on week days.
Initial download of the metrics may take a while.