Fig. 4.
Download original image
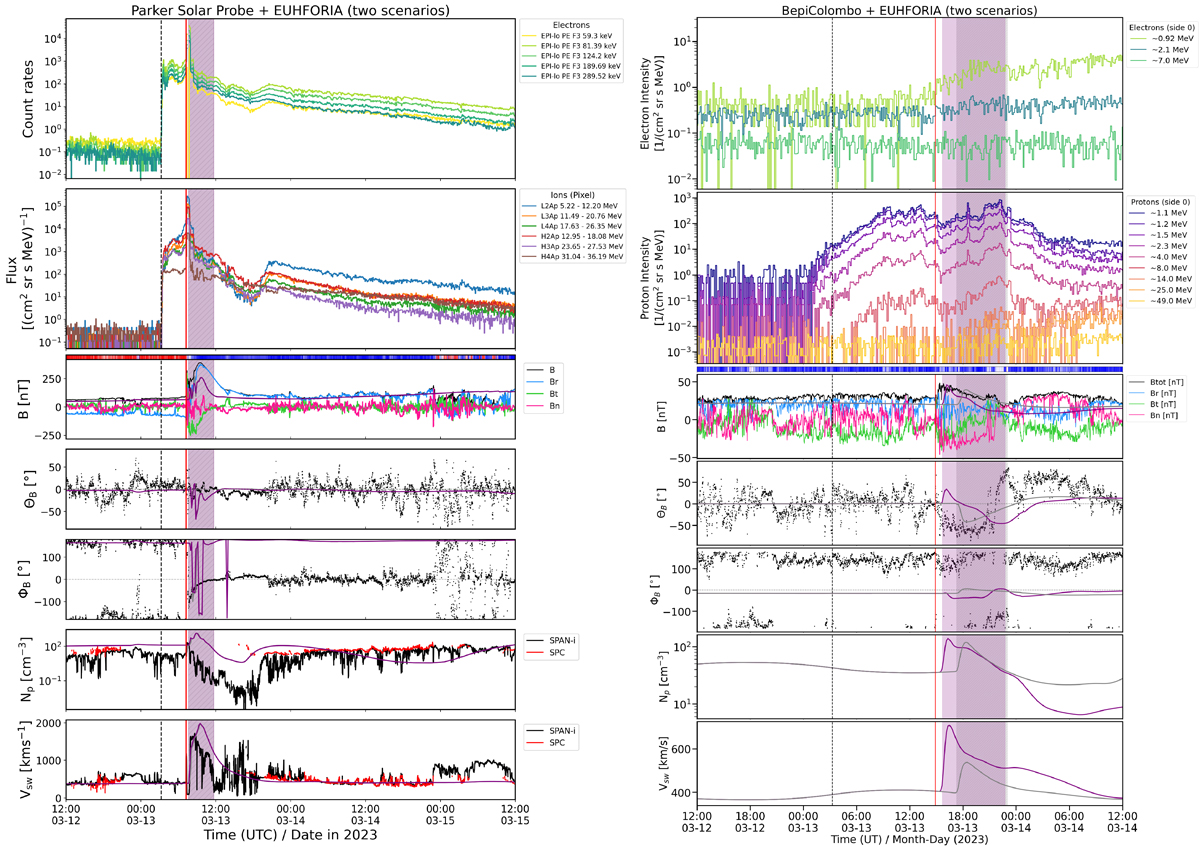
In situ observations in comparison with EUHFORIA simulation results for Parker (left) and BepiColombo (right). From top to bottom, we show energetic electron, and proton measurements, magnetic field (magnitude and RTN components, latitudinal, and azimuthal angle), followed by solar wind density and speed. The results of two different EUHFORIA simulations (purple: blast-wave scenario, gray: pre-CME scenario) are overlaid and show the simulated magnetic field magnitude, magnetic field angles, the solar wind density and speed in comparison with the observations (if available). The shaded regions correspond to the duration of CMEs passing the S/C according to the two different EUHFORIA simulations (same color coding as above). In the case of the pre-event CME scenario, CME5 passes the S/C, and in the case of the blast-wave scenario it is the blast wave connected with the main eruption. The dashed black line marks the onset of the solar eruption, the red line marks the time of the observed IP shock arrivals at the S/C.
Current usage metrics show cumulative count of Article Views (full-text article views including HTML views, PDF and ePub downloads, according to the available data) and Abstracts Views on Vision4Press platform.
Data correspond to usage on the plateform after 2015. The current usage metrics is available 48-96 hours after online publication and is updated daily on week days.
Initial download of the metrics may take a while.