Open Access
Fig. F.1.
Download original image
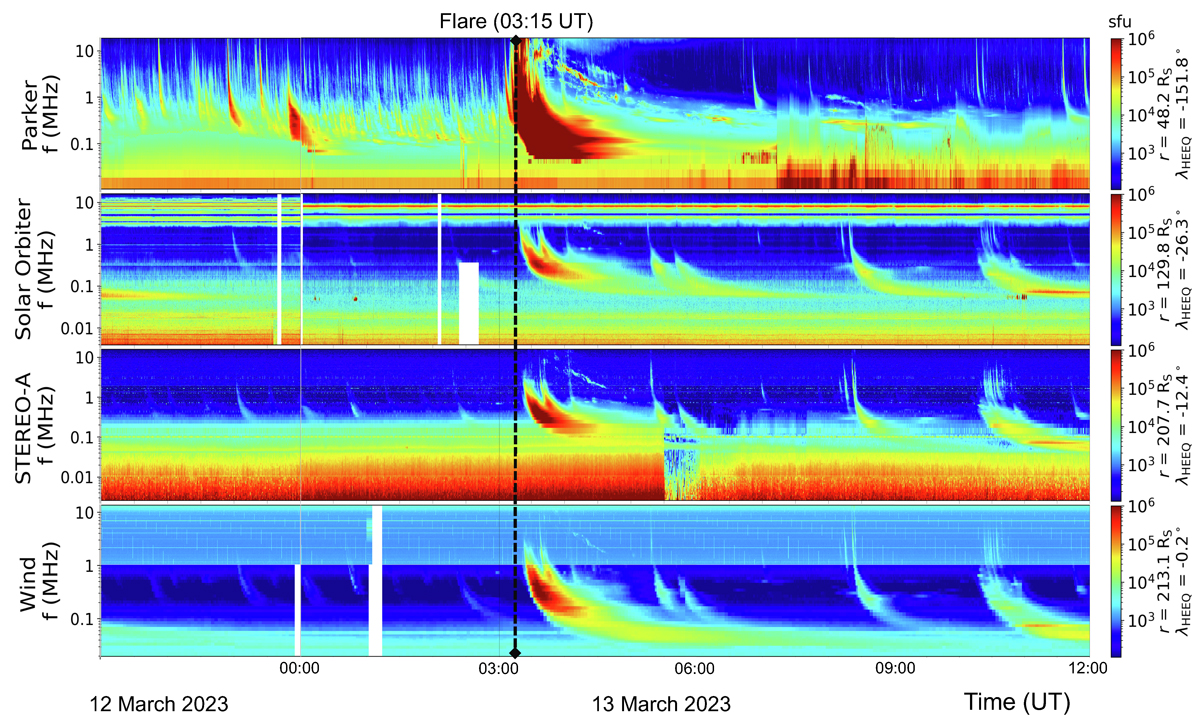
Dynamic radio spectrograms observed, from top to bottom, by Parker, Solar Orbiter, STEREO A, and Wind. The vertical line marks the start time of the eruption. Similar to Fig. D.1, data have been corrected for light travel time and are therefore shifted back to the Sun.
Current usage metrics show cumulative count of Article Views (full-text article views including HTML views, PDF and ePub downloads, according to the available data) and Abstracts Views on Vision4Press platform.
Data correspond to usage on the plateform after 2015. The current usage metrics is available 48-96 hours after online publication and is updated daily on week days.
Initial download of the metrics may take a while.