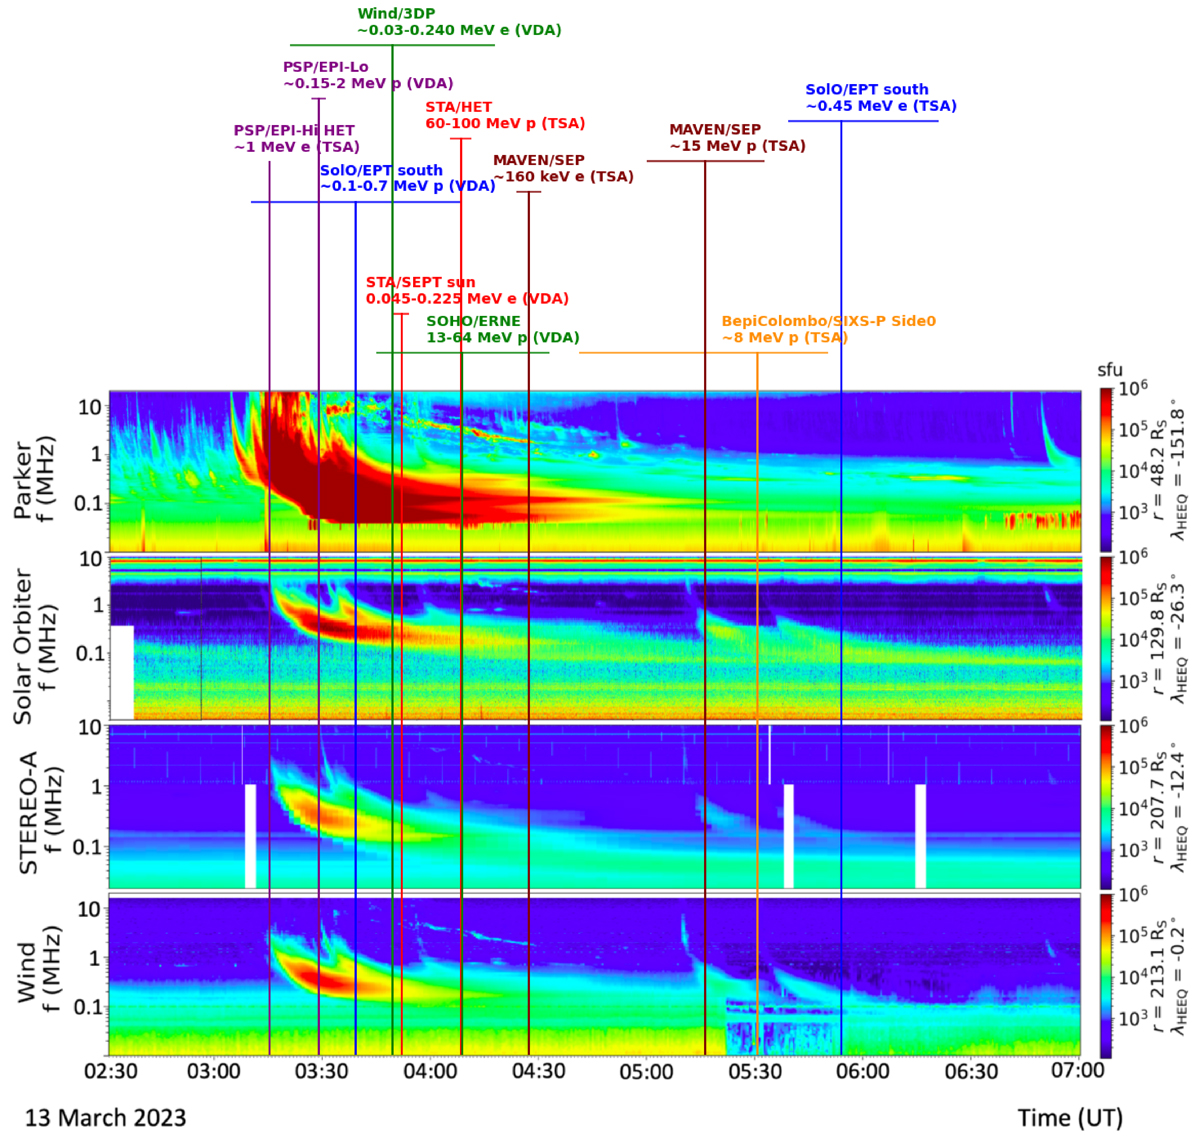
Fig. D.1.
Download original image
Inferred SEP injection times (vertical lines) including uncertainties (horizontal bars) plotted over dynamic radio spectrograms observed, from top to bottom, by Parker, Solar Orbiter, STEREO A, and Wind. The radio data have been corrected for light travel time and are therefor shifted back to the Sun. The annotations on top of each vertical line specify the S/C, instrument, species and energy range used to infer the injection time as well as the method (VDA or TSA) for Parker (PSP, purple), Solar Orbiter (SolO, blue), STEREO A (STA, red), BepiColombo (yellow), Wind (green), and Maven (brown).
Current usage metrics show cumulative count of Article Views (full-text article views including HTML views, PDF and ePub downloads, according to the available data) and Abstracts Views on Vision4Press platform.
Data correspond to usage on the plateform after 2015. The current usage metrics is available 48-96 hours after online publication and is updated daily on week days.
Initial download of the metrics may take a while.