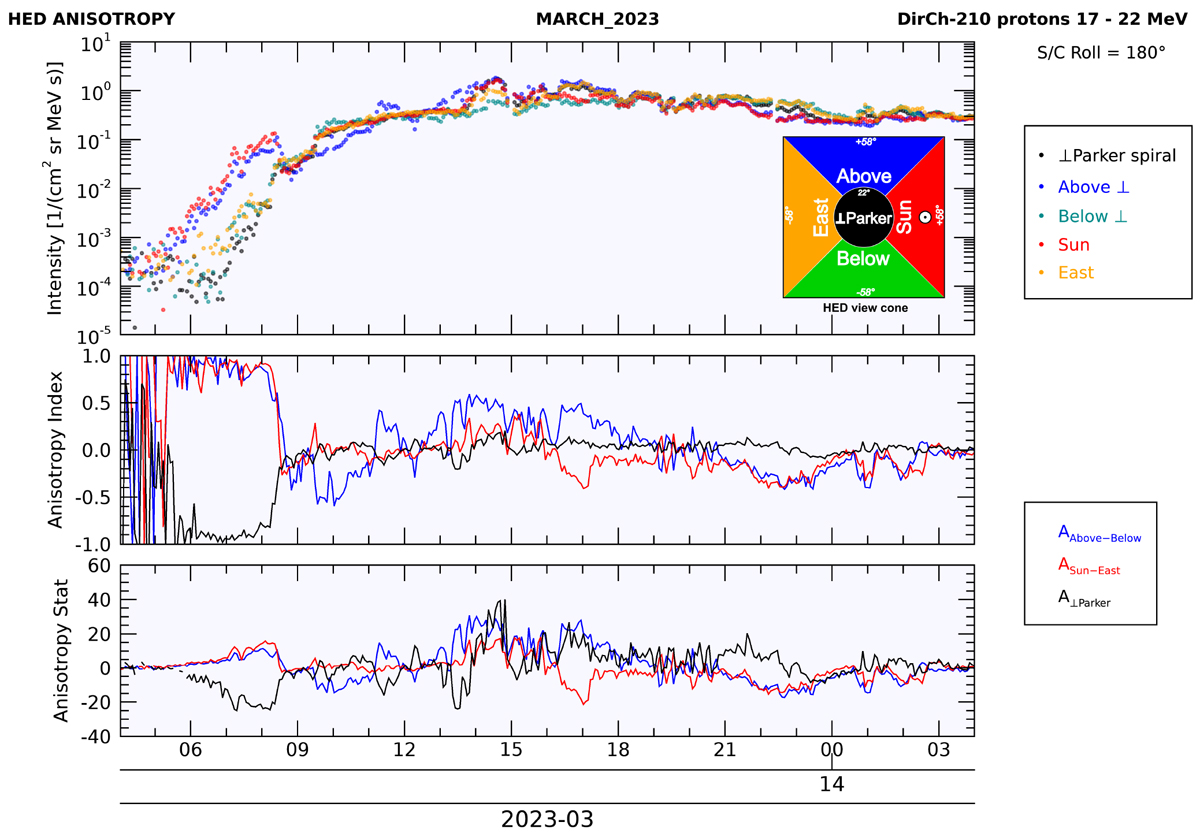
Fig. C.6.
Download original image
ERNE/HED directional intensities and corresponding anisotropy indices. The uppermost panel displays the intensity time evolution in the five selected direction sectors. The sector directions and the direction of the Sun in the square aperture of HED are depicted in the insert at the right-hand corner of the panel. During this time, the HED view cone axis was perpendicular to the nominal IMF direction (Parker spiral). The half angle of the squared aperture is 58° and the half angle of the measurement central cone is 22°. The middle panel shows the values of three anisotropy indices. These are calculated based on the differences of measured intensities (a=Above, b=Below, e=East, s=Sun, z=Zenith): ![]() ,
, ![]() and
and ![]() where
where ![]() is the average intensity of the indicated direction bins. The lowest panel shows the indices weighed by the count statistics.
is the average intensity of the indicated direction bins. The lowest panel shows the indices weighed by the count statistics.
Current usage metrics show cumulative count of Article Views (full-text article views including HTML views, PDF and ePub downloads, according to the available data) and Abstracts Views on Vision4Press platform.
Data correspond to usage on the plateform after 2015. The current usage metrics is available 48-96 hours after online publication and is updated daily on week days.
Initial download of the metrics may take a while.