Fig. C.1.
Download original image
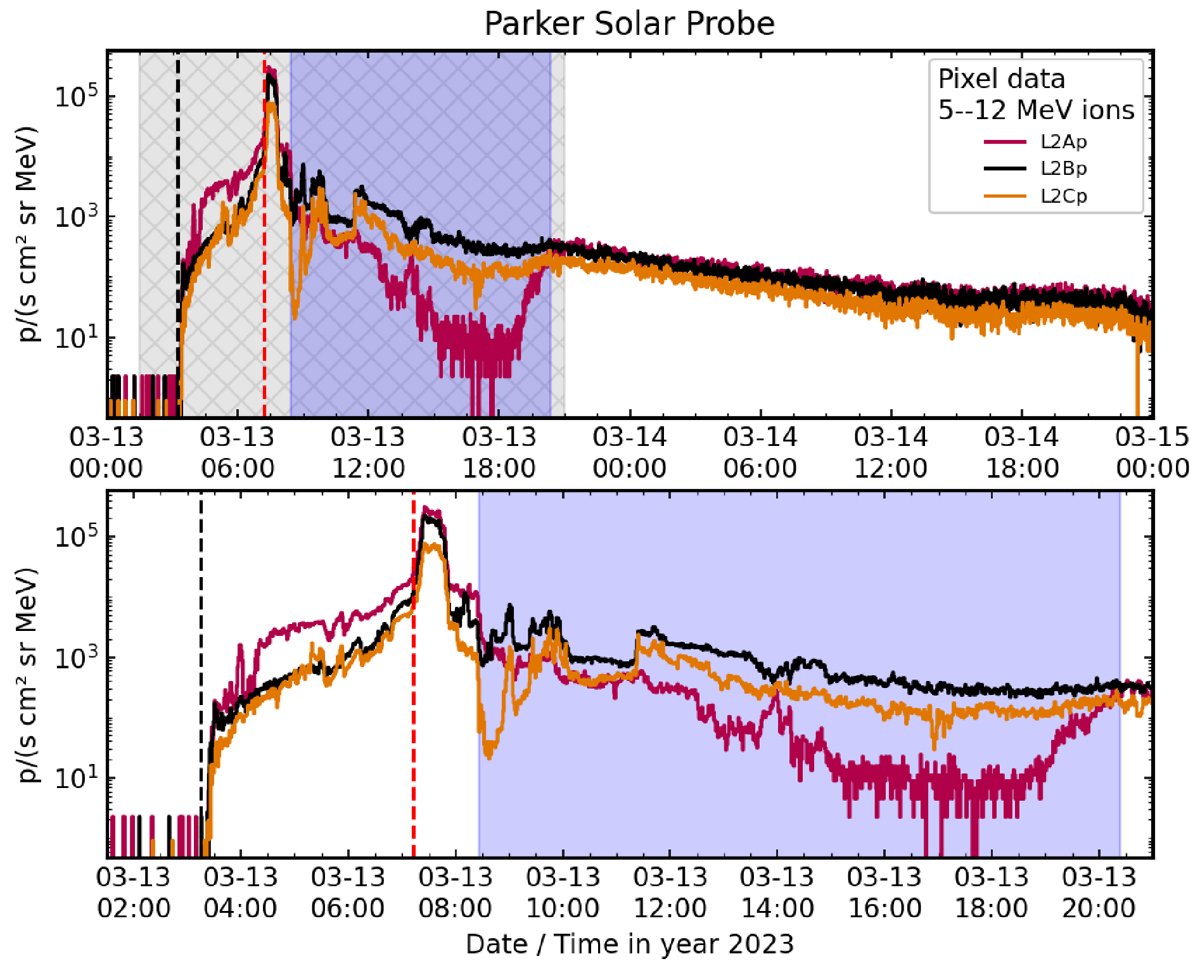
Pixel measurements of ∼8 MeV protons as detected by the three viewing directions of EPI-Hi/LET. The top figure shows the whole event as seen by Parker, the lower panel zooms in around the anisotropic period during the early phase of the event (shaded gray area in the top panel). The shaded blue region marks the CME ejecta passage as determined from solar wind magnetic field and plasma observations as well as electron PADs (shown in Fig. 4, left). The two dashed lines mark the onset time of the solar eruption (black) and the time of the in situ shock arrival (red), respectively.
Current usage metrics show cumulative count of Article Views (full-text article views including HTML views, PDF and ePub downloads, according to the available data) and Abstracts Views on Vision4Press platform.
Data correspond to usage on the plateform after 2015. The current usage metrics is available 48-96 hours after online publication and is updated daily on week days.
Initial download of the metrics may take a while.