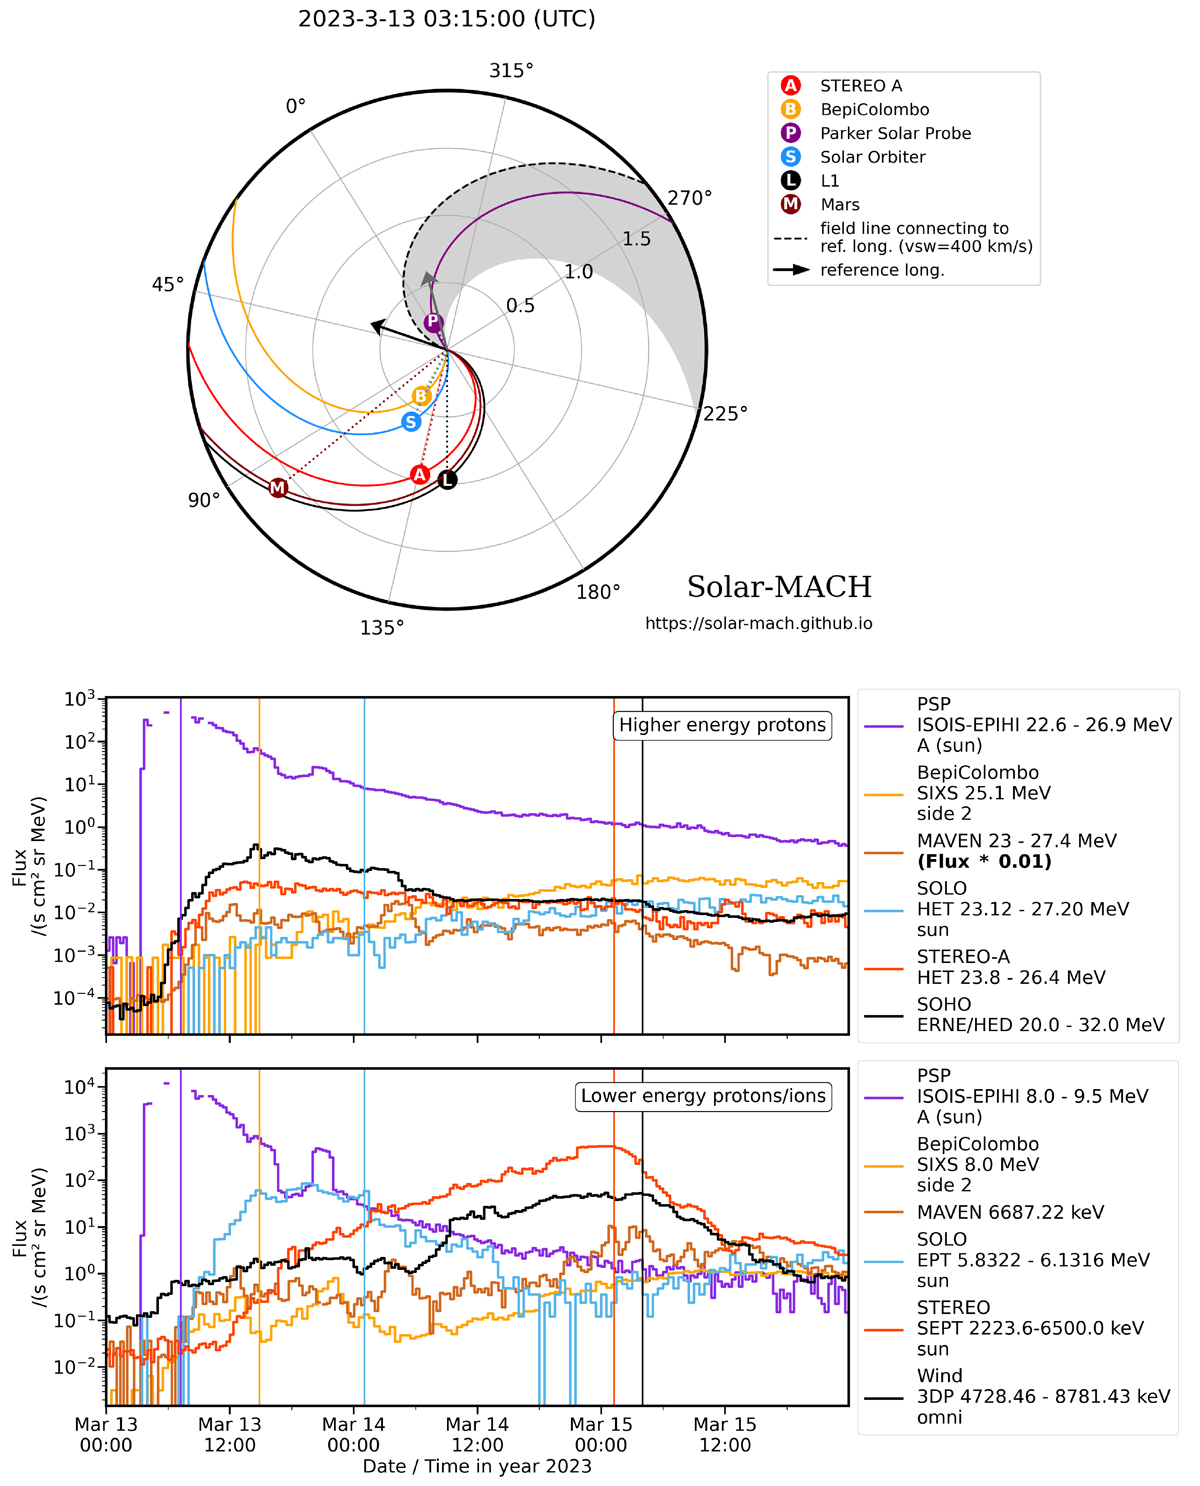
Fig. 1.
Download original image
Top: S/C constellation in the ecliptic plane, including nominal Parker spiral field lines connecting the S/C with the Sun using measured solar wind speed (see Table 1). The shaded area and two arrows mark the longitudinal sector of the potential particle injection of the 13 March 2023 event. Bottom: Intensities (20 min averages) of ∼25 MeV (top) and ∼8 MeV (bottom) ions or protons observed by Parker (PSP, purple), BepiColombo (yellow), Solar Orbiter (SOLO, blue), STEREO A (red), SOHO/Wind (black), and MAVEN (brown, scaled by a factor of 0.01). The vertical lines denote the times of IP shock crossings at the various S/C (using the same color coding).
Current usage metrics show cumulative count of Article Views (full-text article views including HTML views, PDF and ePub downloads, according to the available data) and Abstracts Views on Vision4Press platform.
Data correspond to usage on the plateform after 2015. The current usage metrics is available 48-96 hours after online publication and is updated daily on week days.
Initial download of the metrics may take a while.