Fig. 8
Download original image
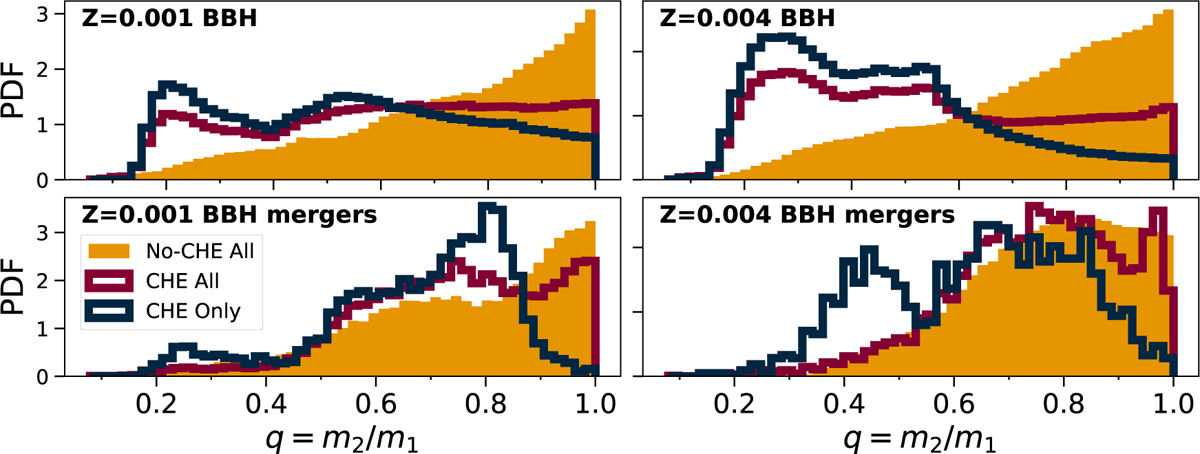
Mass ratio distribution for the BBHs (upper panels) and BBH mergers (lower panels) in the NoCHEpreMS (orange-filled histograms) and CHE10preMS (red histograms) models at Z = 0.001 (left) and Z = 0.004 (right). The plot also shows the distribution only of the binaries in the CHE10preMS models that experienced CHE (blue histograms).
Current usage metrics show cumulative count of Article Views (full-text article views including HTML views, PDF and ePub downloads, according to the available data) and Abstracts Views on Vision4Press platform.
Data correspond to usage on the plateform after 2015. The current usage metrics is available 48-96 hours after online publication and is updated daily on week days.
Initial download of the metrics may take a while.