Fig. 7
Download original image
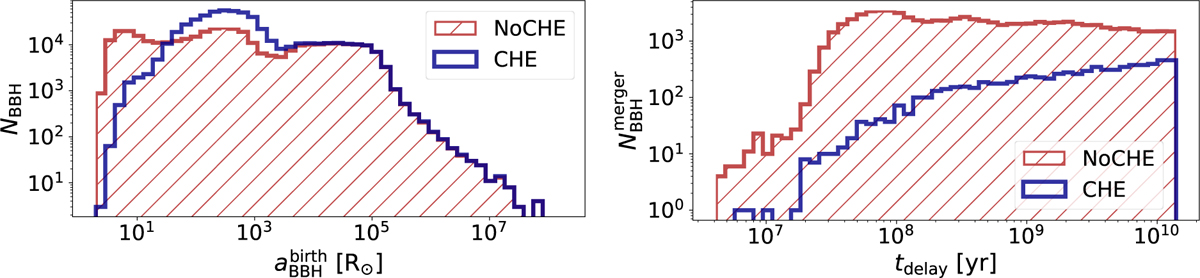
Left panel: distribution of the semi-major axis at the formation of the second black hole for all BBH systems in models with (blue histogram) and without (red histogram) CHE. Right panel: delay time distribution of all BBH mergers in models with (blue histogram) and without (red histogram) CHE. Both panels present results for models with Z = 0.004.
Current usage metrics show cumulative count of Article Views (full-text article views including HTML views, PDF and ePub downloads, according to the available data) and Abstracts Views on Vision4Press platform.
Data correspond to usage on the plateform after 2015. The current usage metrics is available 48-96 hours after online publication and is updated daily on week days.
Initial download of the metrics may take a while.