Fig. 6
Download original image
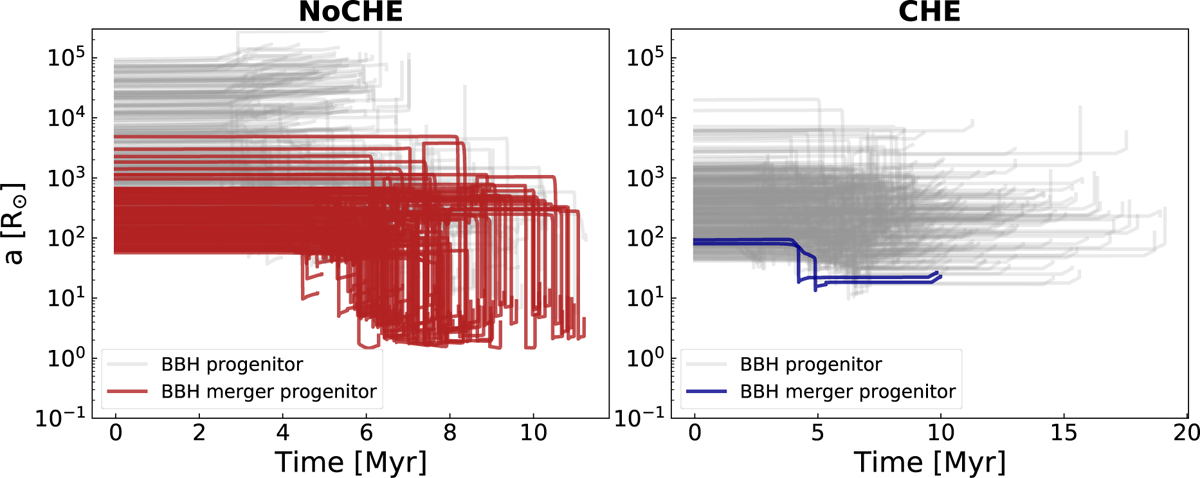
Evolution of the semi-major axis over time for a sample of BBH progenitors in models with (right-hand panel) and without (left-hand panel) CHE. The evolution traces from the birth of the binary to the formation of the BBH (grey lines) or a BBH merger (red and blue lines). The two panels depict models at Z = 0.004, with similar results found at Z = 0.001.
Current usage metrics show cumulative count of Article Views (full-text article views including HTML views, PDF and ePub downloads, according to the available data) and Abstracts Views on Vision4Press platform.
Data correspond to usage on the plateform after 2015. The current usage metrics is available 48-96 hours after online publication and is updated daily on week days.
Initial download of the metrics may take a while.