Fig. 3
Download original image
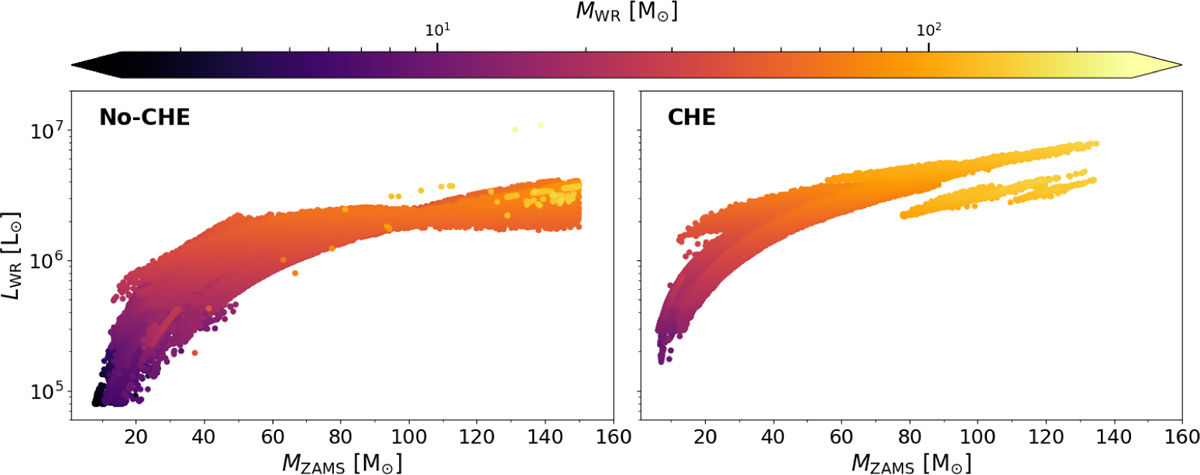
Wolf-Rayet luminosity (LWR) versus the ZAMS mass of their progenitors (MZAMS). The colour scale indicates the WR mass (MWR). LWR and MWR are calculated at the time the star becomes a WR. The left-hand panel shows all the WRs produced in the NoCHEpreMS model, while the right panel shows only the WRs produced by CHE in the CHE10preMS model. The lower luminosity limit in the NoCHEpreMS models arises from the luminosity threshold we set to classify a star as a WR (Sect. 2.4). The lower luminosity limit in the CHE10preMS model derives from the minimum mass requirement for a star to undergo CHE (Sect. 2.2). The plot displays the results for our models at Z = 0.001. We find similar results at Z = 0.004.
Current usage metrics show cumulative count of Article Views (full-text article views including HTML views, PDF and ePub downloads, according to the available data) and Abstracts Views on Vision4Press platform.
Data correspond to usage on the plateform after 2015. The current usage metrics is available 48-96 hours after online publication and is updated daily on week days.
Initial download of the metrics may take a while.