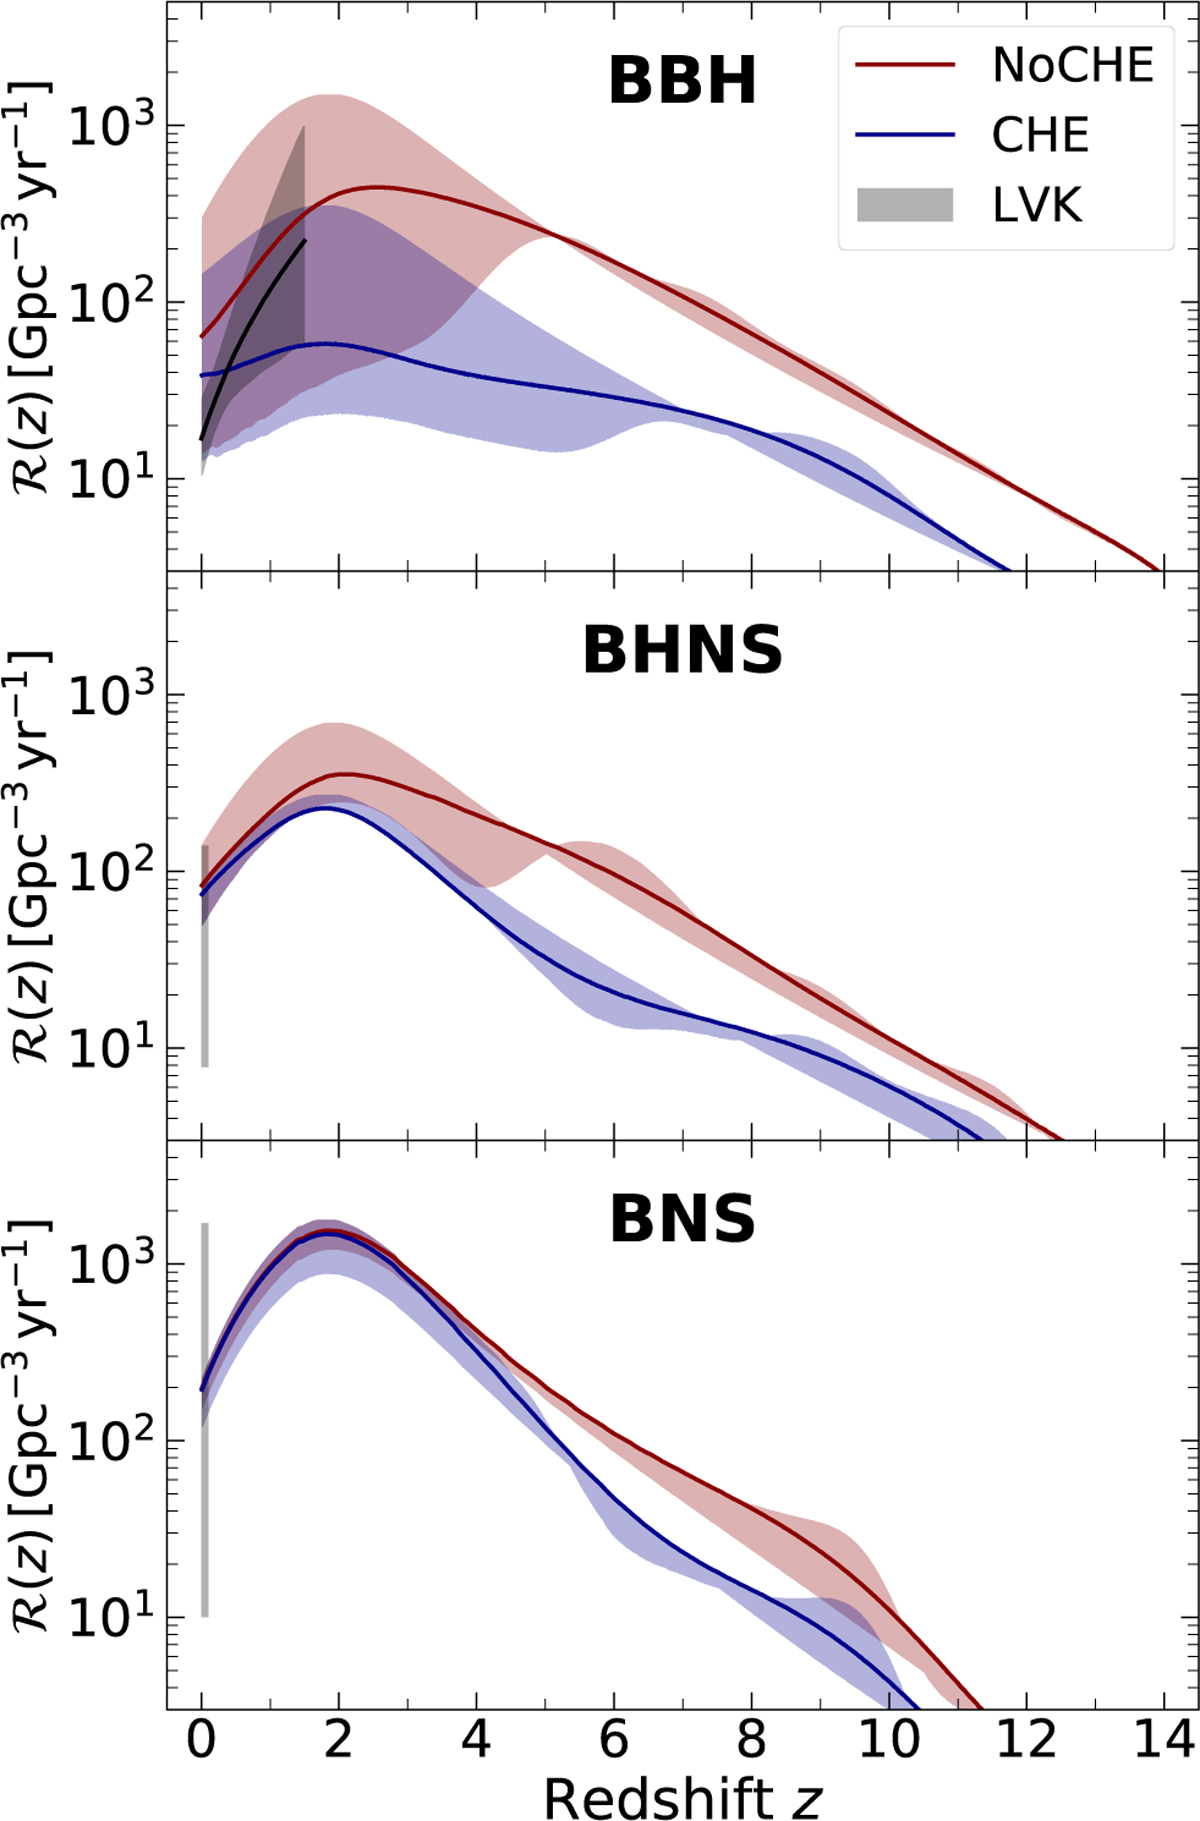
Fig. 12
Download original image
Merger rate density evolution of BBHs (upper panel), BHNSs (central panel), and BNSs (lower panel) as a function of redshift. The red (blue) solid lines represent the merger rate density for mergers produced in the fiducial model NoCHEpreMS (CHElOpreMS), assuming a metallicity spread of σZ = 0.3. The blue and red shaded regions highlight the portions of the plot enclosed by the merger rate density evolution calculated with metallicity spreads of σZ = 0.1 and 0.7. The grey shaded region show the 90% credible interval for the merger rate density evolution with redshift (upper panel), and the local merger rate density (central and bottom panel) reported by Abbott et al. (2023).
Current usage metrics show cumulative count of Article Views (full-text article views including HTML views, PDF and ePub downloads, according to the available data) and Abstracts Views on Vision4Press platform.
Data correspond to usage on the plateform after 2015. The current usage metrics is available 48-96 hours after online publication and is updated daily on week days.
Initial download of the metrics may take a while.