Fig. 4.
Download original image
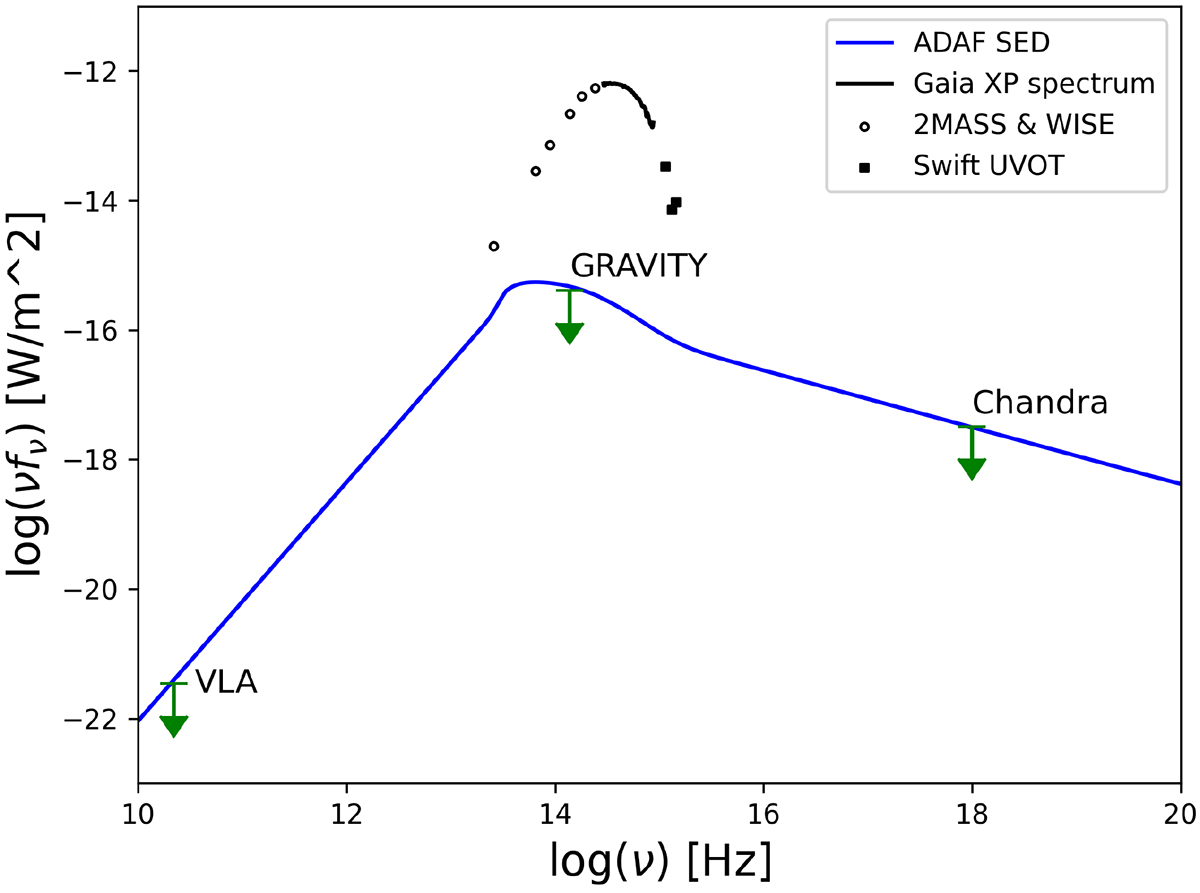
Upper limits on the spectral energy distribution of Gaia BH3 established from radio (August–September 2024; Sjouwerman & Blanchard 2024a,b) and X-ray (May 2024; Cappelluti et al. 2024) observations and the GRAVITY near-infrared observations (June–July 2024). The blue curve represents the accreting BH model presented by Cappelluti et al. (2024) for fEdd < 4.9 × 10⁻⁷.
Current usage metrics show cumulative count of Article Views (full-text article views including HTML views, PDF and ePub downloads, according to the available data) and Abstracts Views on Vision4Press platform.
Data correspond to usage on the plateform after 2015. The current usage metrics is available 48-96 hours after online publication and is updated daily on week days.
Initial download of the metrics may take a while.