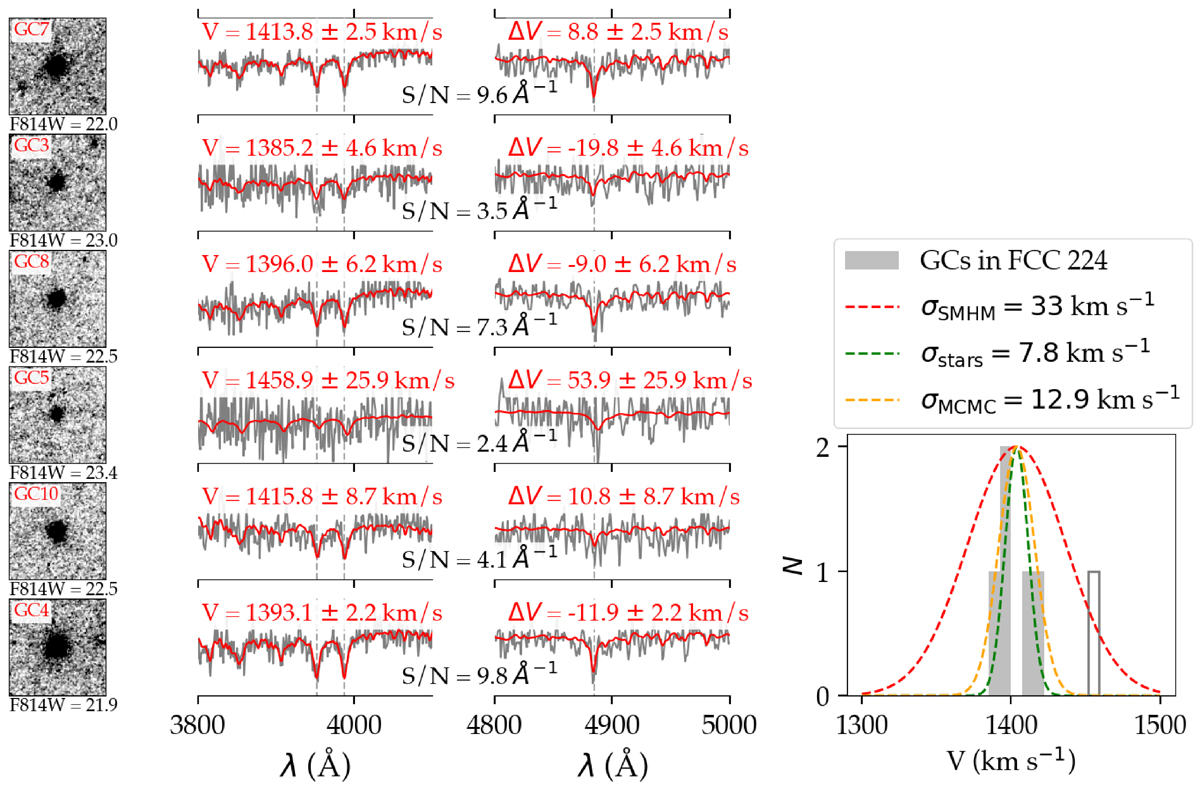
Fig. C.1.
Download original image
Velocities of Individual GCs. First six rows: Left: Close-up of each GC in the KCWI FoV with F814W magnitudes. Middle and right: Blue-arm KCWI spectra focusing on CaH+K and Hβ regions. Each spectrum displays the recovered radial velocity, its offset from the galaxy’s systemic velocity (from integrated starlight), and the S/N. Last row: Radial velocity distribution of GCs around FCC 224. GC5 is excluded due to low S/N. The three Gaussian curves represent expected velocity dispersion from the stellar mass-halo mass relation (Moster et al. 2013) (red), stellar contribution alone (green), and MCMC-derived GC system dispersion using uniform priors (orange).
Current usage metrics show cumulative count of Article Views (full-text article views including HTML views, PDF and ePub downloads, according to the available data) and Abstracts Views on Vision4Press platform.
Data correspond to usage on the plateform after 2015. The current usage metrics is available 48-96 hours after online publication and is updated daily on week days.
Initial download of the metrics may take a while.