Fig. B.1.
Download original image
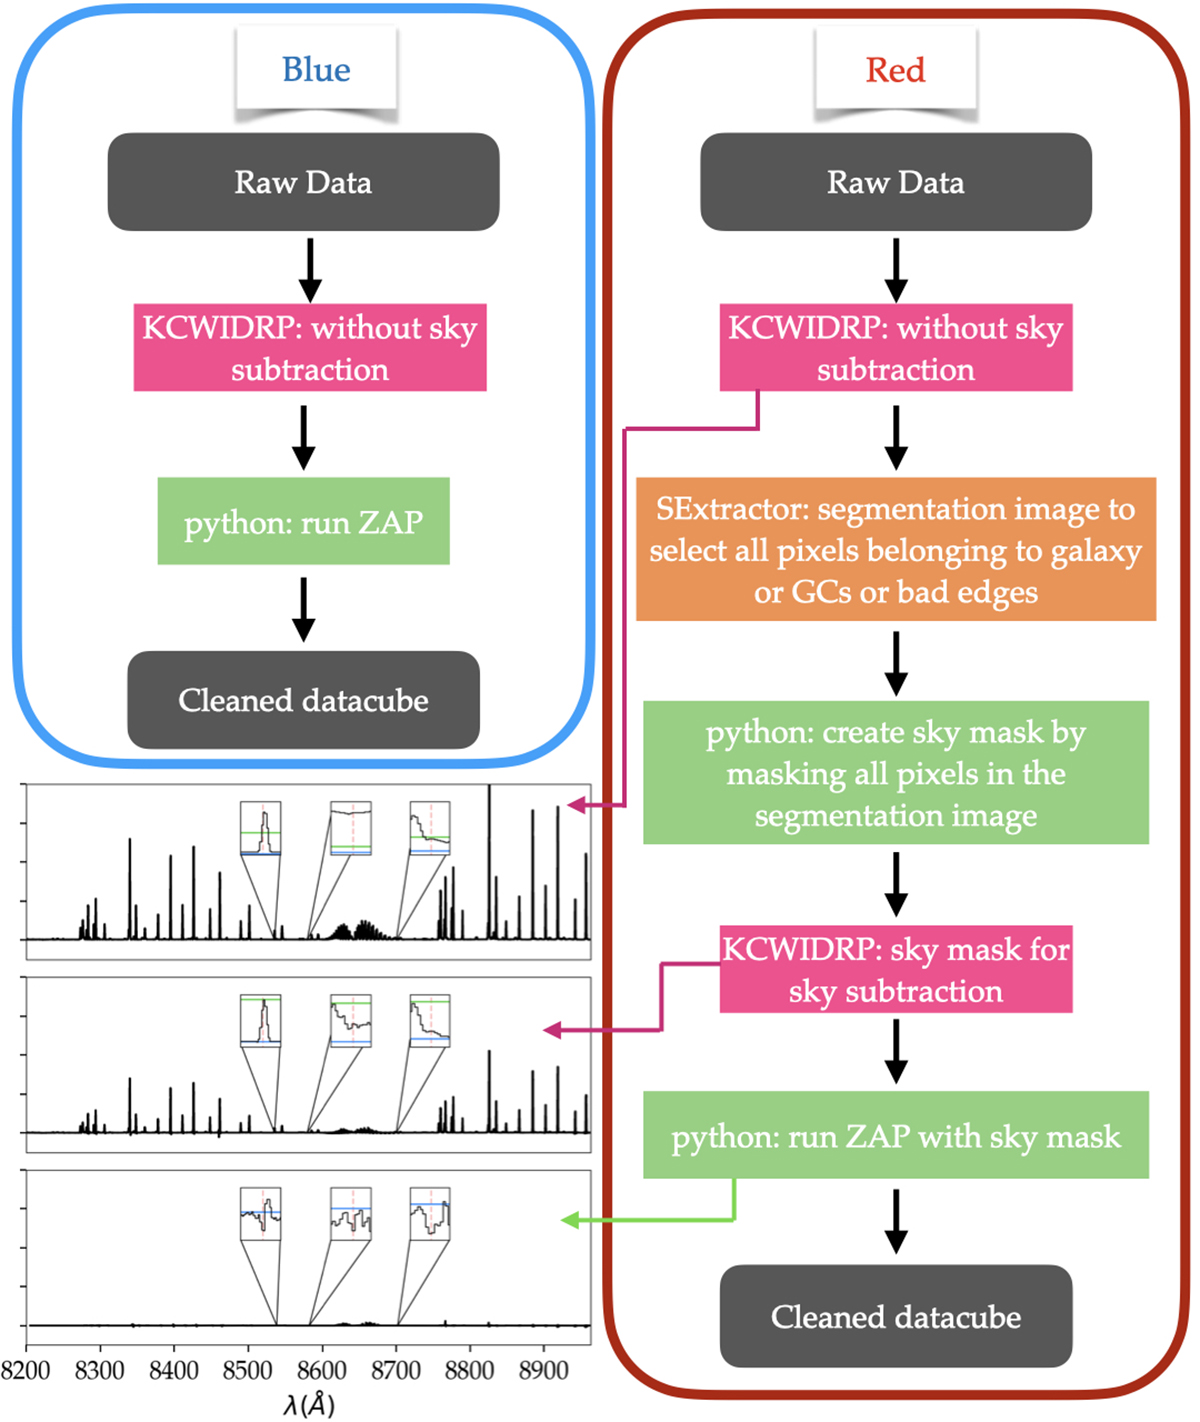
Sky subtraction methodology. On the top left we show the steps applied to reduce the blue-arm data. The right column shows the steps involved in reducing the red-arm data, much more complex given the cosmic ray frequency and presence of many skylines. The bottom left panel shows the power of each method in removing the contribution of skylines in the red-arm spectra. The blue and green lines in the bottom left panel compare the sky levels at each step of the sky subtraction process. Green is after running only KCWIDRP with a sky mask and the blue shows the sky level after applying ZAP.
Current usage metrics show cumulative count of Article Views (full-text article views including HTML views, PDF and ePub downloads, according to the available data) and Abstracts Views on Vision4Press platform.
Data correspond to usage on the plateform after 2015. The current usage metrics is available 48-96 hours after online publication and is updated daily on week days.
Initial download of the metrics may take a while.