Fig. 1.
Download original image
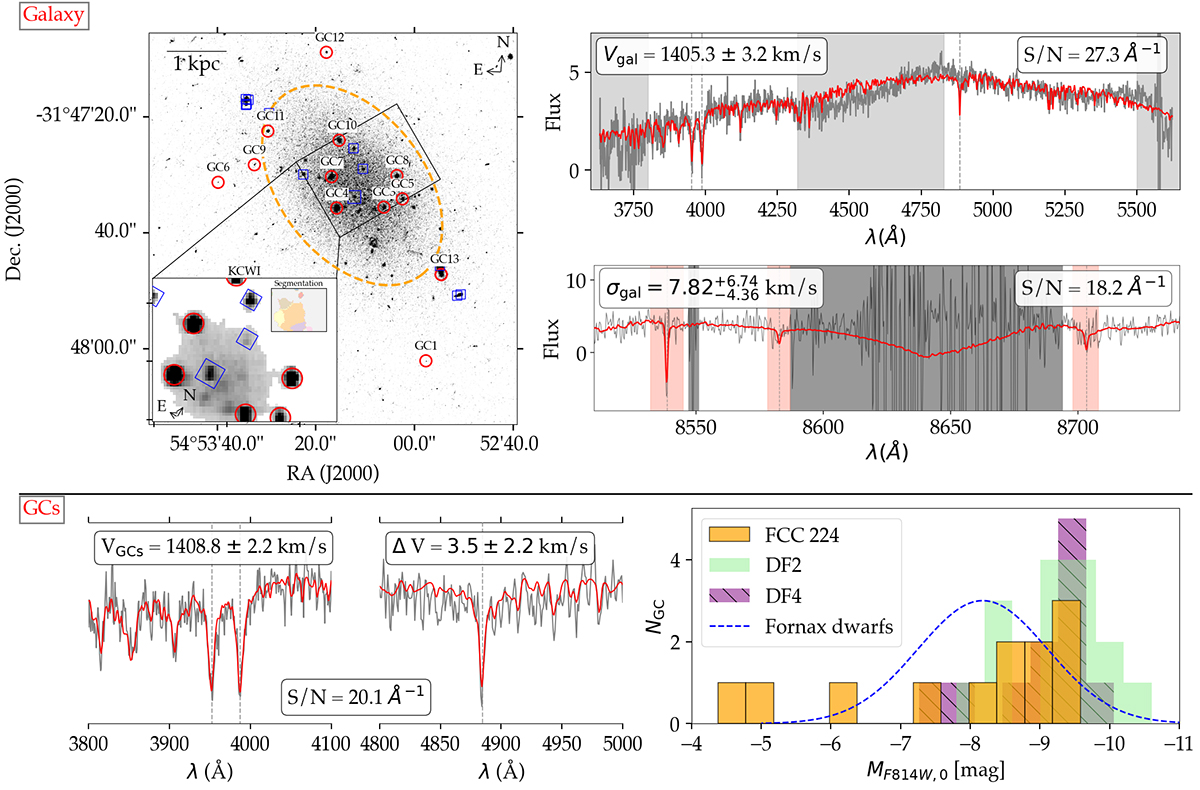
Imaging and spectra of FCC 224 (top section) and its GCs (bottom section). Top left: HST/WFC3 F814W image, highlighting the GC candidates in red circles and background/foreground sources in blue squares. The black rectangle and inset axis show the Keck/KCWI white-light image, along with the segmentation image used to separate galaxy from sky spaxels. The orange dashed ellipse marks the effective radius of the galaxy. Top right: Blue and red KCWI spectra of the stellar body of FCC 224, where grey is the observation and red is the pPXF fit. Masked regions of the spectra are marked as grey bands. The CaT lines are marked in the red-arm spectrum by red bands. In both blue- and red-arm spectra, the dashed lines mark key spectral lines (CaH+K and Hβ in the blue-arm spectrum, and the CaT in the red-arm spectrum). Bottom left and middle: Close-up views of the CaH+K and Hβ regions of the stacked GC spectrum using the blue arm of KCWI. In all of the panels showing spectra, the S/N is shown, as well as the recovered kinematics (e.g. velocity and velocity dispersion) by running pPXF. Bottom right: Comparison of the GCLF of FCC 224 to those of DF2, DF4 and to normal dwarf galaxies in the Fornax cluster as a scaled Gaussian curve (Jordán et al. 2015).
Current usage metrics show cumulative count of Article Views (full-text article views including HTML views, PDF and ePub downloads, according to the available data) and Abstracts Views on Vision4Press platform.
Data correspond to usage on the plateform after 2015. The current usage metrics is available 48-96 hours after online publication and is updated daily on week days.
Initial download of the metrics may take a while.