Fig. A.2.
Download original image
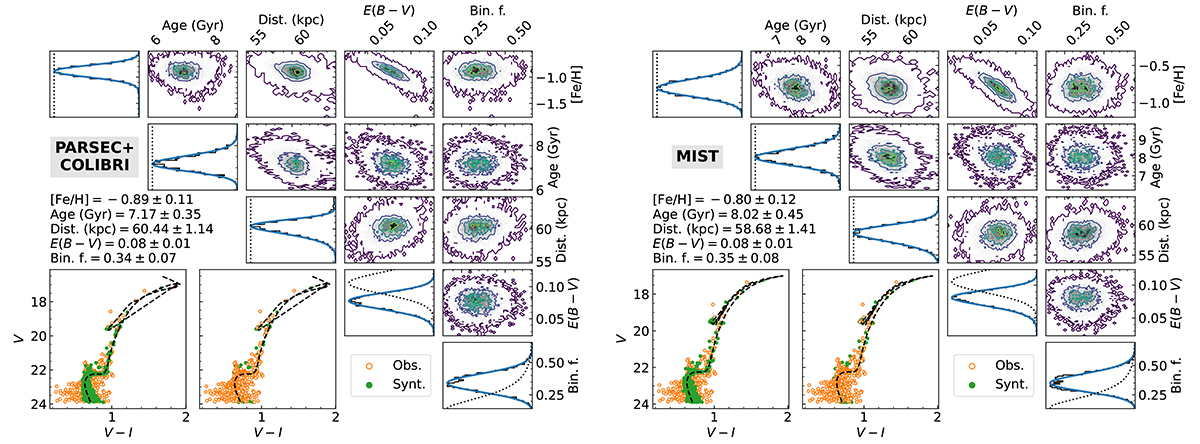
Results from the CMD fitting using PARSEC+COLIBRI isochrones (top) and MIST isochrones (bottom). For each figure, the panels on the top right show the marginalized probability distribution of each pair of fitted parameters. In the main diagonal, the 1D marginalizations are shown as histograms, while the dotted lines represent the priors, and the blue, continuous line indicates the fitted skewed-normal distribution used for inferring the final parameters. In the bottom left panels, the CMDs of the best-fitting synthetic population are shown (hollowed, orange points), together with the corresponding isochrone (dashed, black line) and the observed CMD (filled, green points).
Current usage metrics show cumulative count of Article Views (full-text article views including HTML views, PDF and ePub downloads, according to the available data) and Abstracts Views on Vision4Press platform.
Data correspond to usage on the plateform after 2015. The current usage metrics is available 48-96 hours after online publication and is updated daily on week days.
Initial download of the metrics may take a while.