Fig. 1.
Download original image
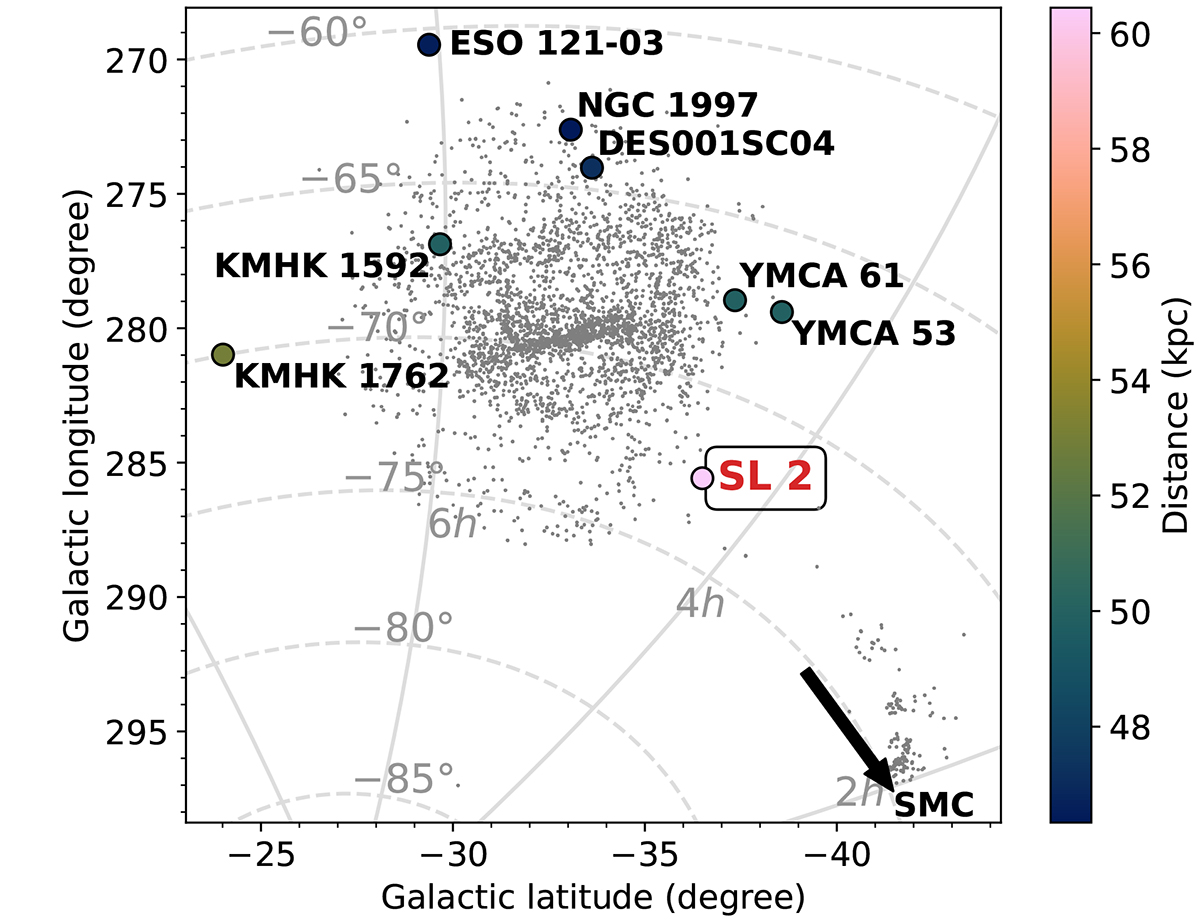
Positions of the LMC age gap clusters. Grey dots indicate the locations of clusters and associations cataloged by Bica et al. (2008). Large circles indicate the positions of age gap clusters with the colors indicating their respective distances (the references for the ages are presented in Table A.2). The black arrow in the bottom right corner points towards the SMC.
Current usage metrics show cumulative count of Article Views (full-text article views including HTML views, PDF and ePub downloads, according to the available data) and Abstracts Views on Vision4Press platform.
Data correspond to usage on the plateform after 2015. The current usage metrics is available 48-96 hours after online publication and is updated daily on week days.
Initial download of the metrics may take a while.