Fig. 9.
Download original image
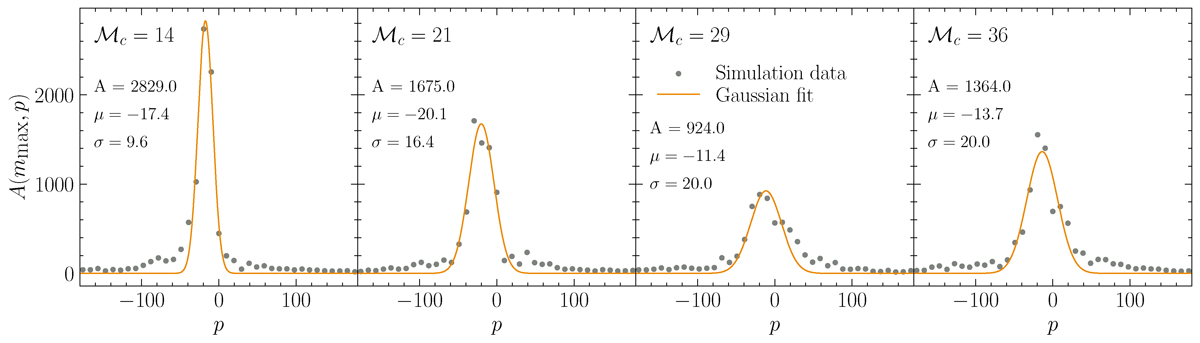
Function A(mmax, p) for runs with ⟨Q⟩ = 1 and varying ℳc (as indicated in the panels), along with their Gaussian fits. Black points show the amplitude of the Fourier transform A(mmax, p) as a function of p (cf., Equation (10)), where mmax is the value of m for which A(m, p) has its maximum. Orange lines show Gaussian fits to the data, with the amplitude A, mean μ, and dispersion σ of each fit as indicated in the legend.
Current usage metrics show cumulative count of Article Views (full-text article views including HTML views, PDF and ePub downloads, according to the available data) and Abstracts Views on Vision4Press platform.
Data correspond to usage on the plateform after 2015. The current usage metrics is available 48-96 hours after online publication and is updated daily on week days.
Initial download of the metrics may take a while.