Open Access
Fig. 8.
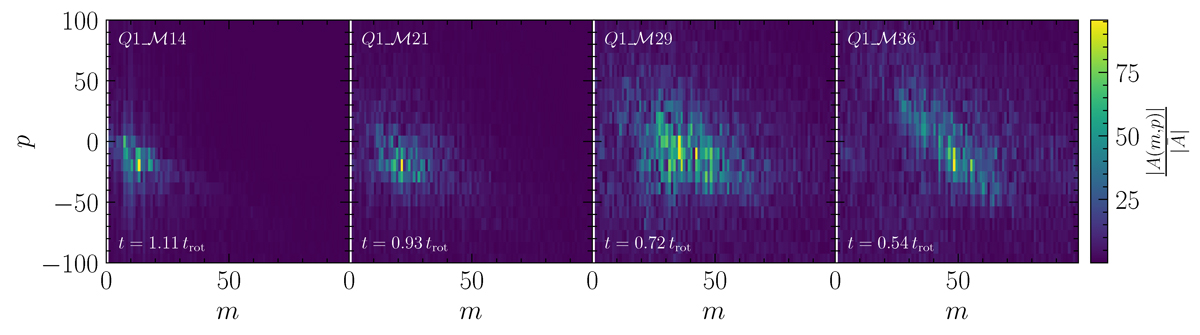
Download original image
Normalised amplitude of the 2D Fourier transform of the galactic annuli shown in Figure 7. Panels show runs with varying ℳc (increasing from left to right). We can see that as ℳc increases the maximum shifts to higher m and the width of the distribution increases.
Current usage metrics show cumulative count of Article Views (full-text article views including HTML views, PDF and ePub downloads, according to the available data) and Abstracts Views on Vision4Press platform.
Data correspond to usage on the plateform after 2015. The current usage metrics is available 48-96 hours after online publication and is updated daily on week days.
Initial download of the metrics may take a while.